The following table shows the amount of converted sugar in a chemical process at different temperatures. Temperature Converted Sugar 1.2 8.2 1.4 8.5 1.6 8.4 1.8 9.3
The following table shows the amount of converted sugar in a chemical process at different temperatures. Temperature Converted Sugar 1.2 8.2 1.4 8.5 1.6 8.4 1.8 9.3

Glencoe Algebra 1, Student Edition, 9780079039897, 0079039898, 2018
18th Edition
ISBN:9780079039897
Author:Carter
Publisher:Carter
Chapter10: Statistics
Section10.1: Measures Of Center
Problem 9PPS

Related questions
Question
Estimate the
Round off your answer to two decimal places.
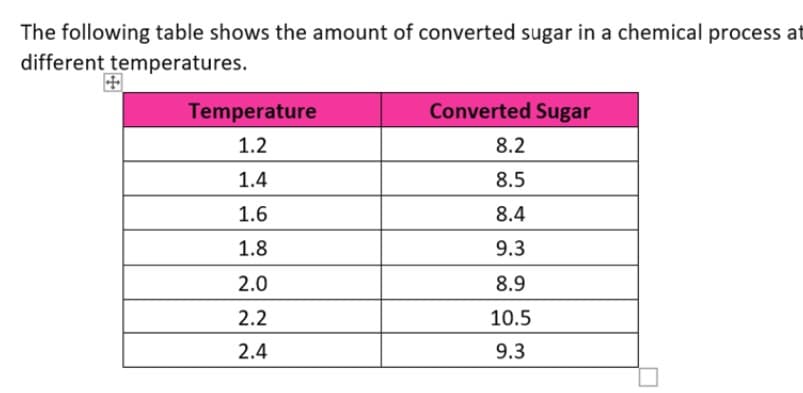
Transcribed Image Text:The following table shows the amount of converted sugar in a chemical process at
different temperatures.
Temperature
Converted Sugar
1.2
8.2
1.4
8.5
1.6
8.4
1.8
9.3
2.0
8.9
2.2
10.5
2.4
9.3
Expert Solution
This question has been solved!
Explore an expertly crafted, step-by-step solution for a thorough understanding of key concepts.

Step by step
Solved in 3 steps with 2 images

Recommended textbooks for you
Glencoe Algebra 1, Student Edition, 9780079039897…
Algebra
ISBN:
9780079039897
Author:
Carter
Publisher:
McGraw Hill

Glencoe Algebra 1, Student Edition, 9780079039897…
Algebra
ISBN:
9780079039897
Author:
Carter
Publisher:
McGraw Hill