
MATLAB: An Introduction with Applications
6th Edition
ISBN: 9781119256830
Author: Amos Gilat
Publisher: John Wiley & Sons Inc
expand_more
expand_more
format_list_bulleted
Related questions
Question
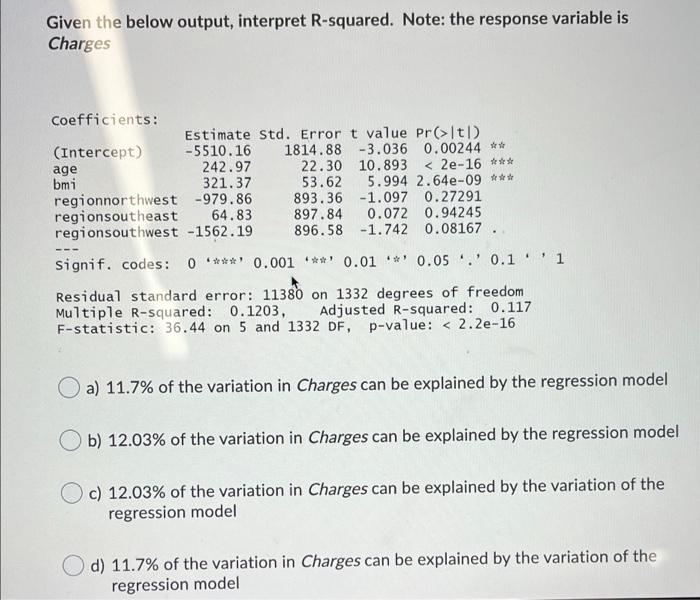

Transcribed Image Text:Given the below output, interpret R-squared. Note: the response variable is
Charges
Coefficients:
(Intercept)
age
bmi
regionnorthwest -979.86
regionsoutheast 64.83
regionsouthwest -1562.19
Estimate Std. Error t value Pr(>|t|)
-5510.16 1814.88 -3.036 0.00244 **
22.30 10.893 < 2e-16 ***
53.62 5.994 2.64e-09 ***
893.36 -1.097 0.27291
897.84 0.072 0.94245
896.58 -1.742 0.08167 .
242.97
321.37
signif. codes: 0 ***' 0.001 **' 0.01 ** 0.05 .' 0.1'1
Residual standard error: 11380 on 1332 degrees of freedom
Multiple R-squared: 0.1203,
F-statistic: 36.44 on 5 and 1332 DF, p-value: < 2.2e-16
Adjusted R-squared: 0.117
O a) 11.7% of the variation in Charges can be explained by the regression model
b) 12.03% of the variation in Charges can be explained by the regression model
c) 12.03% of the variation in Charges can be explained by the variation of the
regression model
d) 11.7% of the variation in Charges can be explained by the variation of the
regression model
Expert Solution
This question has been solved!
Explore an expertly crafted, step-by-step solution for a thorough understanding of key concepts.

This is a popular solution

Trending nowThis is a popular solution!

Step by stepSolved in 2 steps

Knowledge Booster

Similar questions
- Diameter (d) Independent variable 1. 2. 3. 1.00 m 2.00 m 3.00 m 4.00 m 5.00 m 6.00 m 7.00 m Circumference (C) Dependent variable Average value of C/d Plot a graph (Graph number 1) of the circumference of a circle as a function of the diameter using the information in Data Table 1.1. The following guidelines should be used when plotting graphs: Ratio Cld Make the proper choice of graph paper. Use a pen or a sharp pencil. Write neatly and legibly.arrow_forwardPlease do & explain with steps: Subparts e f & g please & thank uarrow_forwardThe Transylvania hypothesis claims that the full moon has an effect on health-related behavior. A study investigating this effect found a significant relationship between the phase of the moon and the (x-4) + 100 where y is the number of consultations as a percentage of the daily mean and x is the days since the last full 15.12 number of general practice consultations nationwide, given by y = 1.9 cos moon. a. What is the period of this function? What is the significance of this period? The period is days. (Round to two decimal places as needed.) Choose the correct meaning of the period p in the context of the problem. The x-distance between the maximum and the minimum of the graph is p. Every p days there is a full moon. There were p% more consultations when there was a full moon. The average number of daily consultations is p. b. If there was a full moon on April 7, on what day in April does this formula predict the maximum number of consultations? What percent increase would be…arrow_forward
- To compute a student's Grade Point Average (GPA) for a term, the student's grades for each course are weighted by the number of credits for the course. Suppose a student had these grades: 4.0 in a 5 credit Math course 2.5 in a 3 credit Music course 2.7 in a 5 credit Chemistry course 3.3 in a 6 credit Journalism course What is the student's GPA for that term? Round to two decimal places Student's GPA =arrow_forward-4 -3 -2 394+ 370 788 756 160 128 96 64 32 -64 -96- -128- -160- -192 -224 -256- -288 -320 -352 -384 4 S 0 Q Estimate the average rate of change from = 4 to 0. Question Help: VIDEO Message instructor Post to forumarrow_forwardConsider the data on climate change below: Variable Intercept CO2 Coefficient SE(Coeff) 0.1584 0.0004 T-ratio -20.1 22.1 P-value |-3.17933 <0.0001 <0.0001 0.00992 s=0.0885 with 58-2=56 degree of freedom. R squared = 89.7%. The response variable is temperature. %3D Then CO2 level for this data is 352.6ppm. a) Find a 90% confidence interval for the mean global temperature anomaly if the CO2 level reaches 450ppm. b) Fina a 90% prediction interval for the mean global temperature anomaly if the CO2 level reaches 450ppm. c) The goal of the Paris climate agreement is to a temperature anomaly of about 1.3degC in our data. If CO2 level do reach 450ppm, would this be a plausible value?arrow_forward
- Suppose the relationship between Y and X is given by: Y = 20.53 + 10.11*X What is Y when X is -100? (Round to two decimal places.)arrow_forwardFor chi-square, what is the difference between observed and expected frequencies? There is no difference: both look at proportions in sample Observed = proportions in sample; expected = proportions in population There is no difference: both look at proportions in population Observed = proportions in population; expected = proportions in samplearrow_forwardYou estimated a regression with the following output. Source | SS df MS Number of obs = 423 -------------+---------------------------------- F(1, 421) = 267.80 Model | 8758968.84 1 8758968.84 Prob > F = 0.0000 Residual | 13769523.8 421 32706.7074 R-squared = 0.3888 -------------+---------------------------------- Adj R-squared = 0.3873 Total | 22528492.7 422 53385.0537 Root MSE = 180.85 ------------------------------------------------------------------------------ Y | Coef. Std. Err. t P>|t| [95% Conf. Interval] -------------+---------------------------------------------------------------- X | 6.150402 .3758334 16.36 0.000 5.411658 6.889145 _cons | -8.022201 24.02003 -0.33 0.739 -55.23632 39.19192…arrow_forward
- The table below gives the population of the small (imaginary) town of Wisteria. What is the average rate of change of the town's population from 1970 to 1980? Give your answer with one decimal place of accuracy to the right of the decimal point, and give appropriate units for your answer.arrow_forwardSee picture for problem. Thxarrow_forwardThe baggage weights for passengers using a particular airline are normally distributed with a mean of 22 lb and a standard deviation of 4 lb. If the limit on total luggage weight is 2158 lb., what is the probability that the limit will be exceeded for 103 passengers? (Give your answer correct to four decimal places.) This got rejected saying thta 2158 could not be right, but it is. The question is correct.arrow_forward
arrow_back_ios
arrow_forward_ios
Recommended textbooks for you
- MATLAB: An Introduction with ApplicationsStatisticsISBN:9781119256830Author:Amos GilatPublisher:John Wiley & Sons Inc
 Probability and Statistics for Engineering and th...StatisticsISBN:9781305251809Author:Jay L. DevorePublisher:Cengage Learning
 Statistics for The Behavioral Sciences (MindTap C...StatisticsISBN:9781305504912Author:Frederick J Gravetter, Larry B. WallnauPublisher:Cengage Learning
  Elementary Statistics: Picturing the World (7th E...StatisticsISBN:9780134683416Author:Ron Larson, Betsy FarberPublisher:PEARSON
 The Basic Practice of StatisticsStatisticsISBN:9781319042578Author:David S. Moore, William I. Notz, Michael A. FlignerPublisher:W. H. Freeman
 Introduction to the Practice of StatisticsStatisticsISBN:9781319013387Author:David S. Moore, George P. McCabe, Bruce A. CraigPublisher:W. H. Freeman
MATLAB: An Introduction with Applications
Statistics
ISBN:9781119256830
Author:Amos Gilat
Publisher:John Wiley & Sons Inc
Probability and Statistics for Engineering and th...
Statistics
ISBN:9781305251809
Author:Jay L. Devore
Publisher:Cengage Learning
Statistics for The Behavioral Sciences (MindTap C...
Statistics
ISBN:9781305504912
Author:Frederick J Gravetter, Larry B. Wallnau
Publisher:Cengage Learning
Elementary Statistics: Picturing the World (7th E...
Statistics
ISBN:9780134683416
Author:Ron Larson, Betsy Farber
Publisher:PEARSON
The Basic Practice of Statistics
Statistics
ISBN:9781319042578
Author:David S. Moore, William I. Notz, Michael A. Fligner
Publisher:W. H. Freeman
Introduction to the Practice of Statistics
Statistics
ISBN:9781319013387
Author:David S. Moore, George P. McCabe, Bruce A. Craig
Publisher:W. H. Freeman