Graph 1 Plot the following continuous data in the grid area below. Make sure you scale your axes so that all of the data will fit in your graph space. This practice data does not have units, so label axes as "x" and "y." Graph 1 plot area Graph 1 data 0.5 10 1 3 1.5 4.5 2.5 3 6.5 7. 4. 5.5 8.5 10 8 11 12345G 789 10 8159 in
Graph 1 Plot the following continuous data in the grid area below. Make sure you scale your axes so that all of the data will fit in your graph space. This practice data does not have units, so label axes as "x" and "y." Graph 1 plot area Graph 1 data 0.5 10 1 3 1.5 4.5 2.5 3 6.5 7. 4. 5.5 8.5 10 8 11 12345G 789 10 8159 in

Algebra & Trigonometry with Analytic Geometry
13th Edition
ISBN:9781133382119
Author:Swokowski
Publisher:Swokowski
Chapter7: Analytic Trigonometry
Section7.6: The Inverse Trigonometric Functions
Problem 94E

Related questions

Question
I need help
Transcribed Image Text:Graph 1
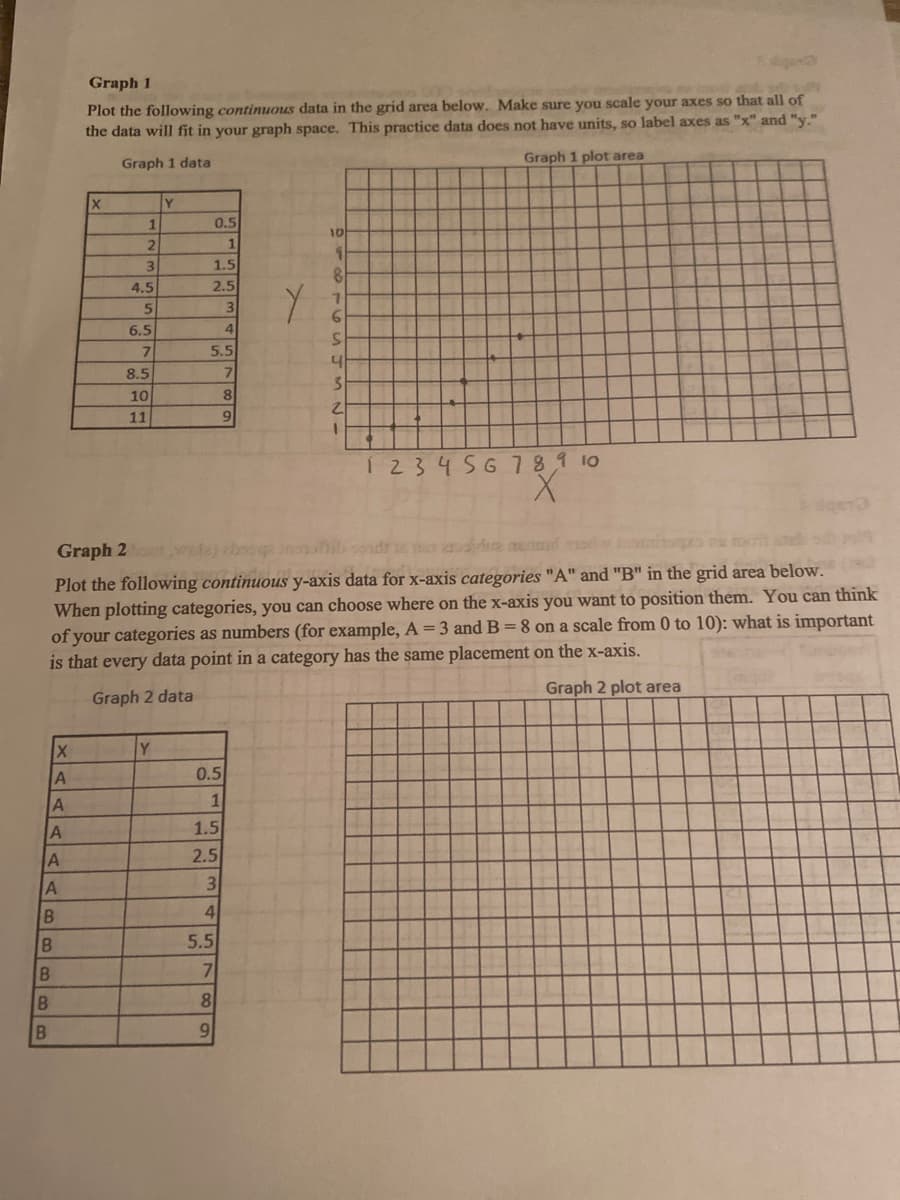
Plot the following continuous data in the grid area below. Make sure you scale your axes so that all of
the data will fit in your graph space. This practice data does not have units, so label axes as "x" and "y."
Graph 1 plot area
Graph 1 data
1
0.5
10
1
1.5
4.5
2.5
6.5
4.
5.5
8.5
10
8
11
1234 5G781 10
Graph 2 wut) cboog
Plot the following continuous y-axis data for x-axis categories "A" and "B" in the grid area below.
When plotting categories, you can choose where on the x-axis you want to position them. You can think
of your categories as numbers (for example, A = 3 and B = 8 on a scale from 0 to 10): what is important
is that every data point in a category has the same placement on the x-axis.
Graph 2 plot area
Graph 2 data
Y
0.5
1
A
1.5
2.5
3
A
4.
5.5
7.
8
9.
Expert Solution
This question has been solved!
Explore an expertly crafted, step-by-step solution for a thorough understanding of key concepts.

Step by step
Solved in 2 steps with 1 images

Knowledge Booster


Learn more about
Need a deep-dive on the concept behind this application? Look no further. Learn more about this topic, algebra and related others by exploring similar questions and additional content below.Recommended textbooks for you
Algebra & Trigonometry with Analytic Geometry
Algebra
ISBN:
9781133382119
Author:
Swokowski
Publisher:
Cengage

Glencoe Algebra 1, Student Edition, 9780079039897…
Algebra
ISBN:
9780079039897
Author:
Carter
Publisher:
McGraw Hill

Functions and Change: A Modeling Approach to Coll…
Algebra
ISBN:
9781337111348
Author:
Bruce Crauder, Benny Evans, Alan Noell
Publisher:
Cengage Learning
Algebra & Trigonometry with Analytic Geometry
Algebra
ISBN:
9781133382119
Author:
Swokowski
Publisher:
Cengage
Glencoe Algebra 1, Student Edition, 9780079039897…
Algebra
ISBN:
9780079039897
Author:
Carter
Publisher:
McGraw Hill
Functions and Change: A Modeling Approach to Coll…
Algebra
ISBN:
9781337111348
Author:
Bruce Crauder, Benny Evans, Alan Noell
Publisher:
Cengage Learning

College Algebra (MindTap Course List)
Algebra
ISBN:
9781305652231
Author:
R. David Gustafson, Jeff Hughes
Publisher:
Cengage Learning