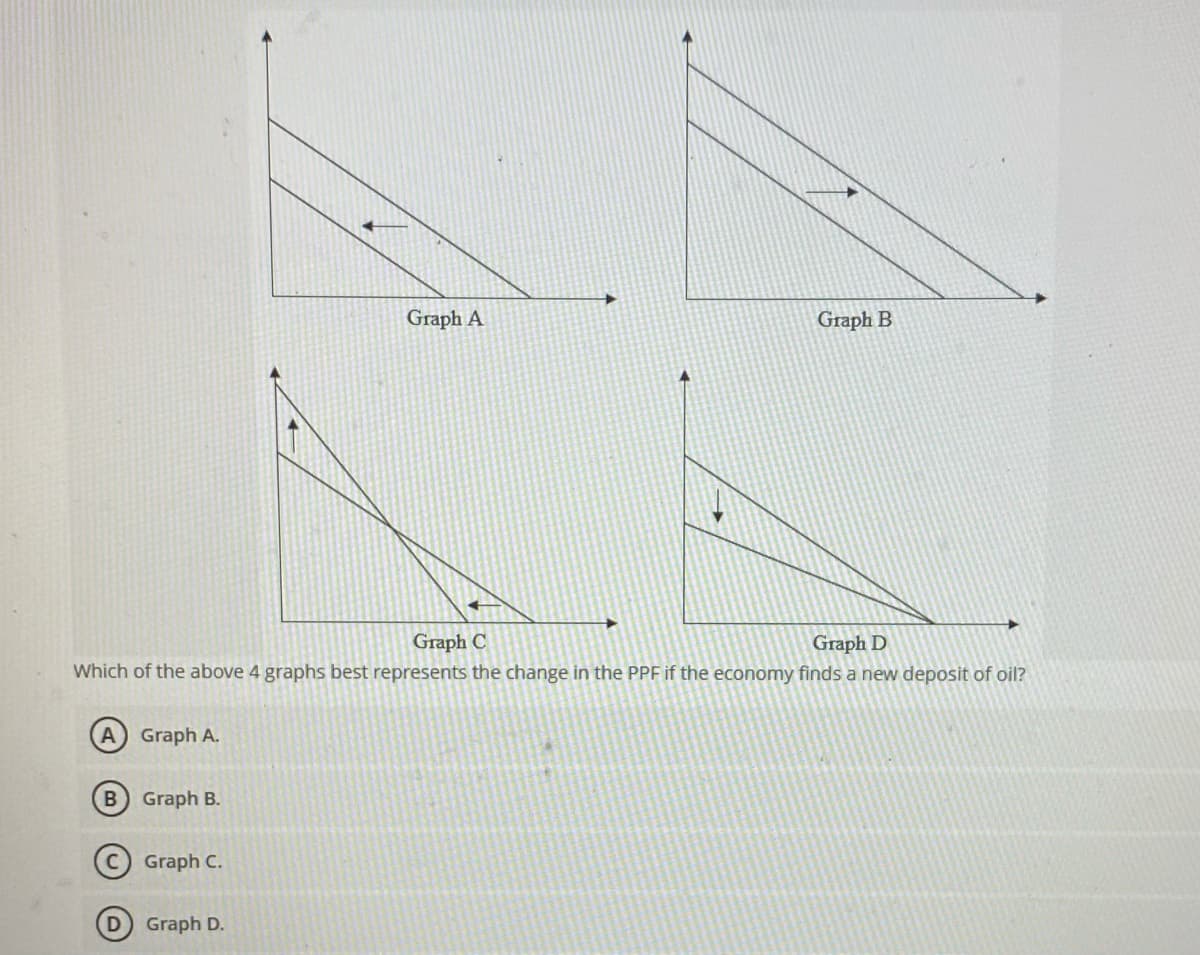
Graph A Graph B Graph C Graph D Which of the above 4 graphs best represents the change in the PPF if the economy finds a new deposit of oil? A Graph A. Graph B. Graph C. Graph D.


Q: Q4: British Columbia (BC) produces lumber and films. Show the impact of each of the following events…
A: Hello, Thank you for the question. Since there are multiple subpart questions posted here, only the…
Q: (plus symbols) represent three possible output levels in a given month. You can click on the points…
A: A (PPF), creation probability bend (PPC), or creation probability limit (PPB), or change…
Q: The table below shows the production of tobacco in the US, in millions of pounds. Tobacco…
A: The average rate of changes has to find out on the basis of given data of year and production of…
Q: Consider an economy that produces and consumes shoes and houses. In the table below are data for two…
A: Given Information: Year Price of a house $ (Px) Number of houses produced (Qx) Price of a pair of…
Q: (a) What is the Consumer Price Index (CPI)? (b) Calculate the CPI for both years. (c) Calculate…
A: Since you have asked multiple questions, we will solve the first three questions for you. If you…
Q: The following diagram represents an economy in which government spending increases. PPF PPF2 C2…
A: Equilibrium wage is determined by the labour market forces labour demand and labour supply . And…
Q: An economy produces capital and consumer goods. Discuss the impact on the PFF due to the following:…
A: PPF(production possibility frontier) shows us various combination of goods(here, capital and…
Q: Discuss. in a general way, how markets would determine the combination of consumer goods and capital…
A: Introduction: A market could be a location where individuals move to exchange product and services.…
Q: .Jane spends $800 on a computer to use in her editing business. She got last year's model n sale for…
A: Gross domestic product(GDP) measures the money value of all final goods and services produced in an…
Q: What is the equilibrium level of output (Y) in this economy? Planned Government Net Exports…
A: In the Keynesian model, also called expenditure-output model, demand plays a significant role in…
Q: Suppose the economy is four sectors economy. The economy is represented by the following: C = 400 +…
A: Aggregate expenditure equation: AE = C + I + G + NX => AE = 400 + 0.40Yd + 25 + 40 + (-25) Note:…
Q: Birefly explain the difference between absolute and relative PPP.
A: Economics as a subject deals with the allocation of scarce resources among humans with unlimited…
Q: 5. Find the equilibrium output for the following economy C = 120 + 0.5(Y – T); I = 250 – 10r; G =…
A: Answer: To find the equilibrium output for this economy we have to equate the IS-curve and LM-curve…
Q: Which statement best describes the circular flow of an economy? the flow between businesses and…
A: In economics, it can be seen that people interact with one another for making business, economic or…
Q: Which consumption theory best explain the consumption behaviour of consumers in our economy
A: Consumption is using the product or service that is being produced in the society. There are several…
Q: what is ? 1-)Expenditure Approach 2-)Income Approach 3-)Production Approach
A: Answer - Expenditure Approach - Expenditure is a method used for calculating "GDP" . By, taking…
Q: Which of the following is considered investment by economists? O I purchased a $10,000 Treasury bond…
A: Investment in economics is the purchase of capital goods or goods that stimulate production of other…
Q: Consider an economy which produces and sells, among a host of other things, 100 million T-shirts a…
A: The total monetary or market worth of all finished goods and services produced inside a country's…
Q: Assume that an economy is operating inside its PPF Explain how you would use the PPF to measure the…
A: The Production Possibilities Frontier and Social Choices : Just as a person cannot have everything…
Q: For each blank place either an “I” if the scenario is an intermediate good, or an “F” if it is a…
A: Hello. Since your question has multiple parts, we will solve the first question for you. If you want…
Q: 14. In 2020 consumption (Ci) for selected countries was as follows Jordan 2.5 billion $, USA 100…
A: The data is fixed in time when is is taken for a given year. And data is varaiable in component of…
Q: An automobile manufacturer uses labor, capital, and a variety of intermediate goods in the…
A: “Since you have posted a question with multiple sub-parts, we will solve the first three subparts…
Q: 9. In 2010 consumption (Ci) for selected countries was as follows Jordan 2.5 billion $, USA 100…
A: We have different consumptions and income combinations of different countries. We required sum of…
Q: Consider an economy that produces and consumes shoes and houses. In the table below are data for two…
A: CPI is measured using fixed basket of goods.
Q: Government spending increases from G1 to G2. Which of the following diagrams best represent the…
A: Picture A is the correct one. If Y=C+G. C=Y-G with h-l = 24 hrs or labor =0, Y=0, C=-G
Q: In which of the three market arenas is each of the following goods traded? A. The athletic skills…
A: The three types of market arenas as per macroeconomics are goods market, labour market and money…
Q: consumes shoes and houses. In the table below are data for two different users. 2000 2001 Price…
A: Nominal GDP measures the market value of goods and services measured at current prices whereas it…
Q: In the simple circular flow of economic activity, goods, and services flow via: a. factor markets to…
A: Circular flow model explains how an economy functions. It analyses the way goods, services and money…
Q: FIGURE 2-3 E F Consumption Goods Refer to Figure 2-3. Which of the following movements will result…
A: Note: We’ll answer the first question since the exact one wasn’t specified. Please submit a new…
Q: Use the following information for question 6–7. 6. In 2021, a typical family in Pizzaland consumes…
A: Here, the price and quantity of pizza, chicken wings and beer is given for year 2021 and 2022.
Q: Assume the economy experiences an increase in non-market transactions and a decrease in market…
A: Non-market transactions is an economic transaction or activity that happens in the informal area…
Q: 9. Economics is the study of
A: To find : What is economics.
Q: Monica grows coconuts and catches fish. Last year she harvested 1500 coconuts and 600 fish. She…
A: Consumption in economics refers to how households use commodities and services. Contrary to…
Q: this question is for macronomics but on bartleby does not show any opiton for macronomics it just…
A: Nominal GDP is calculated by multiplying current year prices with current year quantities. Real GDP…
Q: What is the equilibrium in this economy? Planned Net Exports (NX) Government Change in Real GDP (Y)…
A: equilibrium income: When an economy or company has an equivalent amount of supply and consumer…
Q: Which of the following is NOT accounted in the expenditure approach? a. Food b. Furniture c. Used…
A: GDP is the value of all final goods and services produced in an economy over a period of time. There…
Q: Calculate the PPP-adjusted GDP for each of the four countries using the information found in the…
A: Purchasing power parity (PPP) is used to compare countries' currencies using a common basket of…
Q: Potential GDP Aggregate expenditure AE, E, 45° Real GDP (Y) On the 45 degrees line: O A. GDP is…
A: Aggregate expenditure is the sum of consumption , investment, government spending and net exports in…
Q: Imagine an economy that only produces burgers. Kathleen is the queen of that economy and she has a…
A: GDP refers to the market value of good and services produced within the domestic boundaries of a…
Q: Consider a simple economy of Korea - producing two goods, Motor bike and milk. The details of the…
A: A production possibility frontier (PPF), also knows as a production possibility curve (PPC) or an…
Q: Consider an economy where private businesses/household did not have access to funds. Consider an…
A: The loanable funds market refers to a market place where the savers of the funds and buyers of the…


Trending now
This is a popular solution!

Step by step
Solved in 3 steps


- k Your college bookstore receives a shipment of new economics texts for $60,000. This transaction is O A. included in GDP calculation under consumption. B. not included in GDP calculation, since books bought by the bookstore are intermediate goods. C. not included in GDP since books are exempt from GDP calculation. D. included in GDP under investment since the bookstore earns a profit by selling these books to students. JUL 14 atv MacBook Pro G Search or type URL W X Clear all + N Check answer A Que Que Que Que: Ques Ques QuesWhich statement best describes the circular flow of an economy?the flow between businesses and resourcesthe exchange of money, goods, and services in an economya circular flow happens only in a resource marketa circular flow happens only in a goods and services marketASAP!! ANSWER PLEASE Suppose there are only two commodities that can produced in an economy, computers and cycles. If the producer decides to produce one more cycle then why does it cost more to produce the second cycle than to produce the first one, assuming that the cycles are identical? Elaborate your answer using the concept of Production Possibility curve
- Hello: Which of the following best describes a microeconomic question? (A) What is the value of US dollar in terms of other foreign currencies? (B) Should a particular firm enter a market? (C) Is the company of Japan in a recession? (D) What is the value of the goods and services that the United States produces every year? (E) What is the aggregate price level in an economy?An automobile manufacturer uses labor, capital, and a variety of intermediate goods in the production of cars. The car requires $4,000 of steel, $6,000 seats, $10,000 of electronics, $2,000 tires, $10,000 of labor, $5,000 of capital and has a 20% sales markup to consumers. a. What is the total value of intermediate goods? b. What are the total payments to factors of production? c. What is the total value of sales? d. What is the value of GDP from the sale of this car?Subject: Business Economics Q): An economy produced three goods: organ, apple & organ juice. It is assumes that half of the organ are bought & consumed as final good, the other half is used to produce organ juice. In 2019, 20 KG of organ are produced at RS. 50/kg. 40kg of apple are produced at 100/kg, & 25 glasses of organ juice are produced at Rs.200/ glass. In 2020, 40 KG of organ are produced at RS. 80/kg. 60kg of apple are produced at 110/kg, & 30 glasses of organ juice are produced at Rs.195/ glass. Assuming 2019 as base year, Calculate real, nominal GDP & GDP deflator in 2019 & 2020.
- You are given the following information about an economy: $millionsGDP at Market Prices 1,669.4Imports 290.5Gross Domestic Capital Formation 48.7Income accruing to the Public Sector 39.0Retained Business Earnings 75.9Exports 273.4Subsidies 16.8Factor Payments from Abroad 10.0Capital Consumption Allowance…You are given the following information about an economy: $millionsGDP at Market Prices 1,669.4Imports 290.5Gross Domestic Capital Formation 48.7Income accruing to the Public Sector 39.0Retained Business Earnings 75.9Exports 273.4Subsidies 16.8Factor Payments from Abroad 10.0Capital Consumption Allowance…Assume an economy producing only two goods (shoes and computers) with a fixed amount of productive resources and technology and employing all its productive resources to the maximum. The maximum output combinations of both goods are given in the table below: Combination Shoes ComputersShoes ComputersA 0 1000B 100 900C 200 750D 300 550E 400 300F 500 0 i. Draw the PPF using your knowledge about the shape and slope of PPC.ii. Does the PPF have the expected shape? iii. Explain why your PPF in (a) above depicts that shape.iv. How many computers could society produce if it was willing to do without shoes?v. Why are points outside the frontier unattainable?vi. Identify three ways by which the economy can attain the level of production outside the PPF. vii. What happens to the PPF when technological change overwhelmingly favours the production of computers?viii. What happens to the PPF when the economy discovers an improved technology for producing shoes?
- Suppose an economyuses two resorces (labor and capital) to produce two goods (wheat and cloth). Captial is relativley more useful in prducing cloth, and labor ir relativley more useful in prducing wheat. If the supply of cpatial falls by 10% and the suppy of labor increases by 10%, how will the PPF for wheat and cloth change?Derive the IS relation for this closed economy: C = 200 + 0.25YD I = 200 + 0.25Y – 1000i G = 400 T = 200G, 9 Economics

