Graph B:r=-01, p - .979 (fail to reject null hypothesis) Scatter Plot of Social Media Use (hrs) by Depression Double click to activate 16 14 10 20 30 40 Depression Given the information provided, what should we conclude about the relationship between Social Media Use and Depression? (Read each answer choice very carefuly before choosing) We should base our decisions on Graph A and conclude there is a significant positive correlation between Social Media Use and Depression We should base our decisions on Graph A and conclude there is a sigrificant negative correlation between Social Media Use and Depression We should base our decisions on Graph B and conclude there is a significant negative correlation between Social Media Use and Depression O We should consider the outlier in Graph A as problematic. Removing that outlier (seen in Graph B) reveals that there does not appear to be a significant correlation between Social Media Use and Depression. Social Media Use (hrs)
Graph B:r=-01, p - .979 (fail to reject null hypothesis) Scatter Plot of Social Media Use (hrs) by Depression Double click to activate 16 14 10 20 30 40 Depression Given the information provided, what should we conclude about the relationship between Social Media Use and Depression? (Read each answer choice very carefuly before choosing) We should base our decisions on Graph A and conclude there is a significant positive correlation between Social Media Use and Depression We should base our decisions on Graph A and conclude there is a sigrificant negative correlation between Social Media Use and Depression We should base our decisions on Graph B and conclude there is a significant negative correlation between Social Media Use and Depression O We should consider the outlier in Graph A as problematic. Removing that outlier (seen in Graph B) reveals that there does not appear to be a significant correlation between Social Media Use and Depression. Social Media Use (hrs)

Glencoe Algebra 1, Student Edition, 9780079039897, 0079039898, 2018
18th Edition
ISBN:9780079039897
Author:Carter
Publisher:Carter
Chapter10: Statistics
Section10.3: Measures Of Spread
Problem 8PPS

Related questions
Question
graphs A and B are in photo
Transcribed Image Text:Graphs
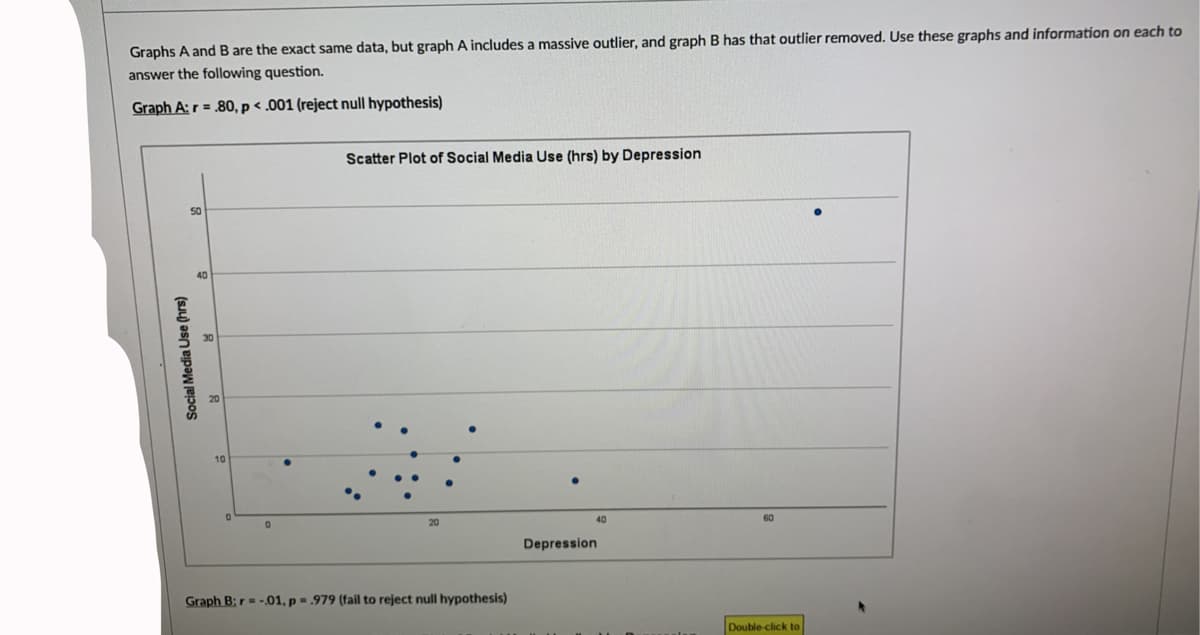
and B are the exact same data, but graph A includes a massive outlier, and graph B has that outlier removed. Use these graphs and information on each to
answer the following question.
Graph A:r = .80, p < .001 (reject null hypothesis)
Scatter Plot of Social Media Use (hrs) by Depression
50
40
Depression
Graph B: r -01, p = .979 (fail to reject null hypothesis)
Double-click to
Social Media Use (hrs)
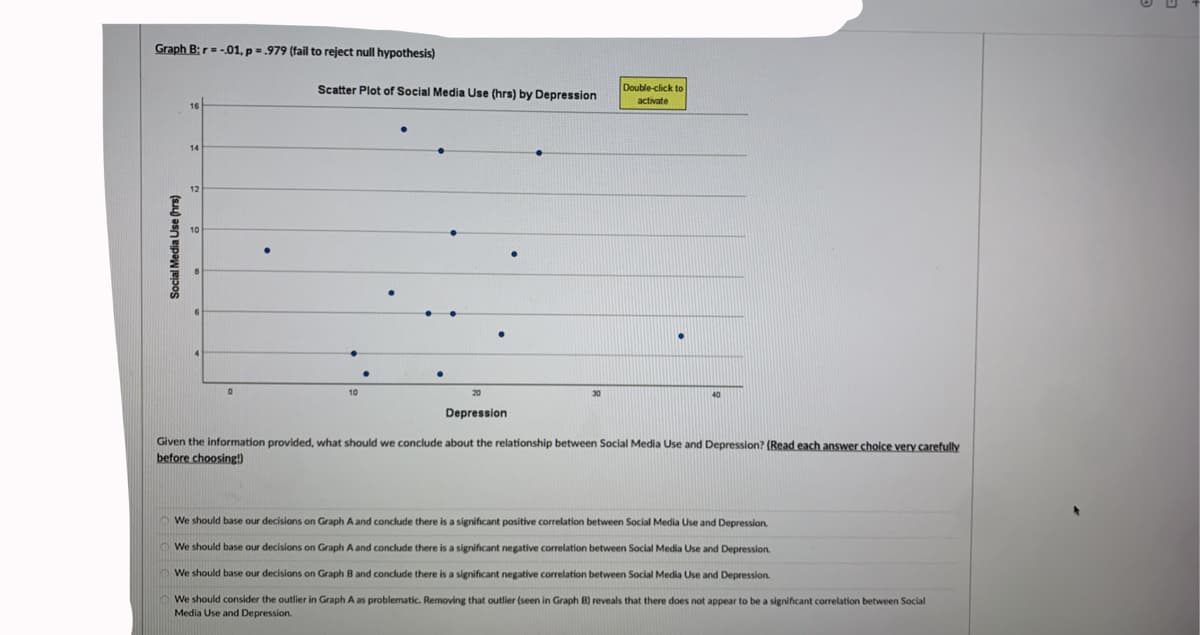
Transcribed Image Text:Graph B:r= -01, p = .979 (fail to reject null hypothesis)
Scatter Plot of Social Media Use (hrs) by Depression
Double-click to
activate
16
14
12
10
Depression
Given the information provided, what should we conclude about the relationship between Social Media Use and Depression? (Read each answer choice very carefully
before choosing!)
We should base our decisions on Graph A and conclude there is a significant positive correlation between Social Media Use and Depression.
We should base our decisions on Graph A and conclude there is a significant negative correlation between Social Media Use and Depression.
O We should base our decisions on Graph B and conclude there is a significant negative correlation between Social Media Use and Depression.
We should consider the outlier in Graph A as problematic. Removing that outlier (seen in Graph B) reveals that there does not appear to be a significant correlation between Social
Media Use and Depression.
Social Media Use (hrs)
Expert Solution
This question has been solved!
Explore an expertly crafted, step-by-step solution for a thorough understanding of key concepts.

This is a popular solution!

Trending now
This is a popular solution!

Step by step
Solved in 2 steps with 2 images

Recommended textbooks for you
Glencoe Algebra 1, Student Edition, 9780079039897…
Algebra
ISBN:
9780079039897
Author:
Carter
Publisher:
McGraw Hill

Big Ideas Math A Bridge To Success Algebra 1: Stu…
Algebra
ISBN:
9781680331141
Author:
HOUGHTON MIFFLIN HARCOURT
Publisher:
Houghton Mifflin Harcourt

Holt Mcdougal Larson Pre-algebra: Student Edition…
Algebra
ISBN:
9780547587776
Author:
HOLT MCDOUGAL
Publisher:
HOLT MCDOUGAL
Glencoe Algebra 1, Student Edition, 9780079039897…
Algebra
ISBN:
9780079039897
Author:
Carter
Publisher:
McGraw Hill
Big Ideas Math A Bridge To Success Algebra 1: Stu…
Algebra
ISBN:
9781680331141
Author:
HOUGHTON MIFFLIN HARCOURT
Publisher:
Houghton Mifflin Harcourt
Holt Mcdougal Larson Pre-algebra: Student Edition…
Algebra
ISBN:
9780547587776
Author:
HOLT MCDOUGAL
Publisher:
HOLT MCDOUGAL