Hand Computation of this, same with the result of the software excel and jamovi: A psychologist would like to research if the Hope scale(Synder, et al., 1991) scores differ between those living in City A and City B. The 12-item scale consisted of two subscales: a 6-item agency subscale and a 6-item pathways subscales. Scores on the 12 items were averaged, with higher scores indicating higher levels of hope. The following scores were obtained. Use Student’s t-test for Independent Groups, alpha at .05 2 tail City A - 43 38 36 38 52 60 58 66 55 63 City B - 62 34 35 52 58 72 57 55 80 67
Hand Computation of this, same with the result of the software excel and jamovi: A psychologist would like to research if the Hope scale(Synder, et al., 1991) scores differ between those living in City A and City B. The 12-item scale consisted of two subscales: a 6-item agency subscale and a 6-item pathways subscales. Scores on the 12 items were averaged, with higher scores indicating higher levels of hope. The following scores were obtained. Use Student’s t-test for Independent Groups, alpha at .05 2 tail City A - 43 38 36 38 52 60 58 66 55 63 City B - 62 34 35 52 58 72 57 55 80 67

MATLAB: An Introduction with Applications
6th Edition
ISBN:9781119256830
Author:Amos Gilat
Publisher:Amos Gilat
Chapter1: Starting With Matlab
Section: Chapter Questions
Problem 1P

Related questions
Topic Video
Question
Hand Computation of this, same with the result of the software excel and jamovi:
A psychologist would like to research if the Hope scale(Synder, et al., 1991) scores differ between those living in City A and City B. The 12-item scale consisted of two subscales: a 6-item agency subscale and a 6-item pathways subscales. Scores on the 12 items were averaged, with higher scores indicating higher levels of hope. The following scores were obtained.
Use Student’s t-test for Independent Groups, alpha at .05 2 tail
City A - 43 38 36 38 52 60 58 66 55 63
City B - 62 34 35 52 58 72 57 55 80 67
![jamovi - Untitled
Data
Analyses
Edit
Exploration
T-Tests
ANOVA
Regression
Frequencies
Factor
Modules
Independent Samples T-Test
Independent Samples T-Test
Independent Samples T-Test
Grouping Variable
da B
Statistic
df
Mean difference
SE difference
Effect Size
->
A
Student's t
-1.08
18.0
0.295
-6.30
5.84
Cohen's d
-0.483
Tests
Additional Statistics
V Student's
V Mean difference
Assumptions
Bayes factor
O Confidence interval
95
9%
Normality Test (Shapiro-Wilk)
Prior 0.707
V Effect size
O Welch's
O Confidence interval
95
A
0.973
0.819
O Mann-Whitney U
V Descriptives
Note. A low p-value suggests a
violation of the assumption of
normality
V Descriptives plots
Нуpothesis
O Group 1 * Group 2
Assumption Checks
Homogeneity of Variances Test (Levene's)
Group 1 > Group 2
V Homogeneity test
df
df2
Group 1 < Group 2
V Normality test
A
0.0700
1
18
0.794
V Q-Q plot
Missing values
Note. A low p-value suggests a violation of the
assumption of equal variances
O Exclude cases analysis by analysis
[3]
Exclude cases listwise
7:30 PM
^ ĝ d») * O , ENG
4/29/2021](/v2/_next/image?url=https%3A%2F%2Fcontent.bartleby.com%2Fqna-images%2Fquestion%2Fa952a9f5-365c-44fe-aa23-c179e9585882%2Fef984f50-8121-4c28-a813-2b01e9c6399f%2Fleh0wyq_processed.png&w=3840&q=75)
Transcribed Image Text:jamovi - Untitled
Data
Analyses
Edit
Exploration
T-Tests
ANOVA
Regression
Frequencies
Factor
Modules
Independent Samples T-Test
Independent Samples T-Test
Independent Samples T-Test
Grouping Variable
da B
Statistic
df
Mean difference
SE difference
Effect Size
->
A
Student's t
-1.08
18.0
0.295
-6.30
5.84
Cohen's d
-0.483
Tests
Additional Statistics
V Student's
V Mean difference
Assumptions
Bayes factor
O Confidence interval
95
9%
Normality Test (Shapiro-Wilk)
Prior 0.707
V Effect size
O Welch's
O Confidence interval
95
A
0.973
0.819
O Mann-Whitney U
V Descriptives
Note. A low p-value suggests a
violation of the assumption of
normality
V Descriptives plots
Нуpothesis
O Group 1 * Group 2
Assumption Checks
Homogeneity of Variances Test (Levene's)
Group 1 > Group 2
V Homogeneity test
df
df2
Group 1 < Group 2
V Normality test
A
0.0700
1
18
0.794
V Q-Q plot
Missing values
Note. A low p-value suggests a violation of the
assumption of equal variances
O Exclude cases analysis by analysis
[3]
Exclude cases listwise
7:30 PM
^ ĝ d») * O , ENG
4/29/2021
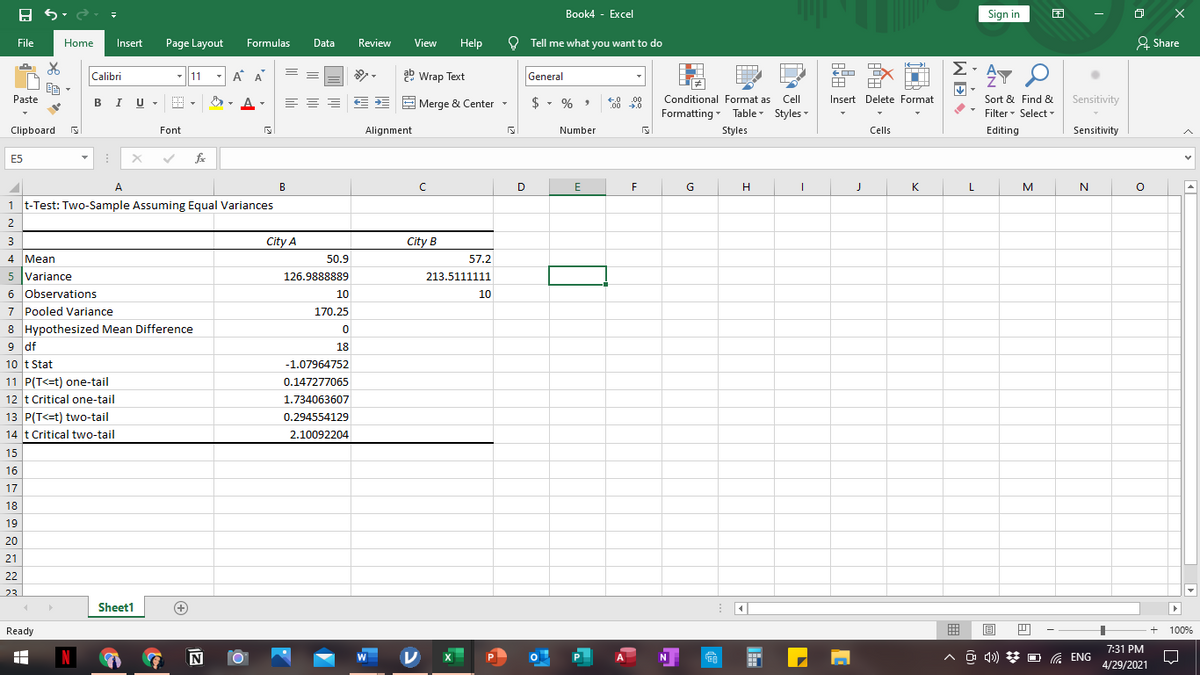
Transcribed Image Text:Book4 - Excel
Sign in
File
Home
Insert
Page Layout
Formulas
Data
Review
View
Help
O Tell me what you want to do
요 Share
Σ
Σ Α.
Calibri
-|11
A A
ab Wrap Text
General
响,
BI U
Sort & Find & Sensitivity
Paste
E -
| Merge & Center
$ - % ,
€.0
.00 4.0
Conditional Format as Cell
Insert Delete Format
Formatting - Table Styles
Filter- Select -
Clipboard
Font
Alignment
Number
Styles
Cells
Editing
Sensitivity
E5
fe
A
B
D
G
H
J
K
M
N
1 t-Test: Two-Sample Assuming Equal Variances
2
3
City A
City B
4 Mean
50.9
57.2
5 Variance
126.9888889
213.5111111
6 observations
7 Pooled Variance
8 Hypothesized Mean Difference
9 df
10
10
170.25
18
10 t Stat
-1.07964752
11 P(T<=t) one-tail
12 t Critical one-tail
0.147277065
1.734063607
13 P(T<=t) two-tail
14 t Critical two-tail
0.294554129
2,10092204
15
16
17
18
19
20
21
22
23
Sheet1
+
Ready
100%
7:31 PM
N
P.
^ ô 4») * O , ENG
W
4/29/2021
WE
面,
Expert Solution
This question has been solved!
Explore an expertly crafted, step-by-step solution for a thorough understanding of key concepts.

Step by step
Solved in 2 steps with 2 images

Knowledge Booster


Learn more about
Need a deep-dive on the concept behind this application? Look no further. Learn more about this topic, statistics and related others by exploring similar questions and additional content below.Recommended textbooks for you
MATLAB: An Introduction with Applications
Statistics
ISBN:
9781119256830
Author:
Amos Gilat
Publisher:
John Wiley & Sons Inc

Probability and Statistics for Engineering and th…
Statistics
ISBN:
9781305251809
Author:
Jay L. Devore
Publisher:
Cengage Learning

Statistics for The Behavioral Sciences (MindTap C…
Statistics
ISBN:
9781305504912
Author:
Frederick J Gravetter, Larry B. Wallnau
Publisher:
Cengage Learning
MATLAB: An Introduction with Applications
Statistics
ISBN:
9781119256830
Author:
Amos Gilat
Publisher:
John Wiley & Sons Inc
Probability and Statistics for Engineering and th…
Statistics
ISBN:
9781305251809
Author:
Jay L. Devore
Publisher:
Cengage Learning
Statistics for The Behavioral Sciences (MindTap C…
Statistics
ISBN:
9781305504912
Author:
Frederick J Gravetter, Larry B. Wallnau
Publisher:
Cengage Learning

Elementary Statistics: Picturing the World (7th E…
Statistics
ISBN:
9780134683416
Author:
Ron Larson, Betsy Farber
Publisher:
PEARSON

The Basic Practice of Statistics
Statistics
ISBN:
9781319042578
Author:
David S. Moore, William I. Notz, Michael A. Fligner
Publisher:
W. H. Freeman

Introduction to the Practice of Statistics
Statistics
ISBN:
9781319013387
Author:
David S. Moore, George P. McCabe, Bruce A. Craig
Publisher:
W. H. Freeman