HW#4 (Costs of Production, Competitive Markets) Attempts: Keep the Highest: /6 20. Problems and Applications Q3 Consider total cost and total revenue, given in the fllowing table: In the final column, enter profit for each quantity. (Note: If the firm suffers a loss, enter a negative number in the appropriate cell.) Total Cost Quantity (Dollars) Marginal Cost Marginal Revenue (Dollars) Total Revenue Profit (Dollars) (Dollars) (Dollars) 12 3 11 18 4 15 24 20 30 26 36 35 42 In order to maximize profit, how many units should the firm produce? Check all that apply. 4 6. In the previous table, enter marginal revenue and marginal cost for each quantity. HW#4 (Costs of Production, Competitive Markets) On the following graph, use the green points (triangle symbol) to graph the marginal-revenue curve, then use the orange points (square symbol) to plot the marginal-cost curve. (Note: Be sure to plot from left to right and to plot between integers. For example, if the marginal cost of increasing production from 1 unit to 2 units is $5, then you would plot a point at (1.5, 5).) 10 Revenue Marginal Cost Quantity The marginal-revenue curve and the marginal-cost curve cross at a quantity This firm in a competitive industry, because marginal revenue is as quantity increases. True or False: The industry is in a long-run equilibrium. True Revenue and Costs
HW#4 (Costs of Production, Competitive Markets) Attempts: Keep the Highest: /6 20. Problems and Applications Q3 Consider total cost and total revenue, given in the fllowing table: In the final column, enter profit for each quantity. (Note: If the firm suffers a loss, enter a negative number in the appropriate cell.) Total Cost Quantity (Dollars) Marginal Cost Marginal Revenue (Dollars) Total Revenue Profit (Dollars) (Dollars) (Dollars) 12 3 11 18 4 15 24 20 30 26 36 35 42 In order to maximize profit, how many units should the firm produce? Check all that apply. 4 6. In the previous table, enter marginal revenue and marginal cost for each quantity. HW#4 (Costs of Production, Competitive Markets) On the following graph, use the green points (triangle symbol) to graph the marginal-revenue curve, then use the orange points (square symbol) to plot the marginal-cost curve. (Note: Be sure to plot from left to right and to plot between integers. For example, if the marginal cost of increasing production from 1 unit to 2 units is $5, then you would plot a point at (1.5, 5).) 10 Revenue Marginal Cost Quantity The marginal-revenue curve and the marginal-cost curve cross at a quantity This firm in a competitive industry, because marginal revenue is as quantity increases. True or False: The industry is in a long-run equilibrium. True Revenue and Costs

Essentials of Economics (MindTap Course List)
8th Edition
ISBN:9781337091992
Author:N. Gregory Mankiw
Publisher:N. Gregory Mankiw
Chapter12: The Cost Of Production
Section: Chapter Questions
Problem 3CQQ

Related questions
Question
Transcribed Image Text:HW#4 (Costs of Production, Competitive Markets)
Attempts:
Keep the Highest: /6
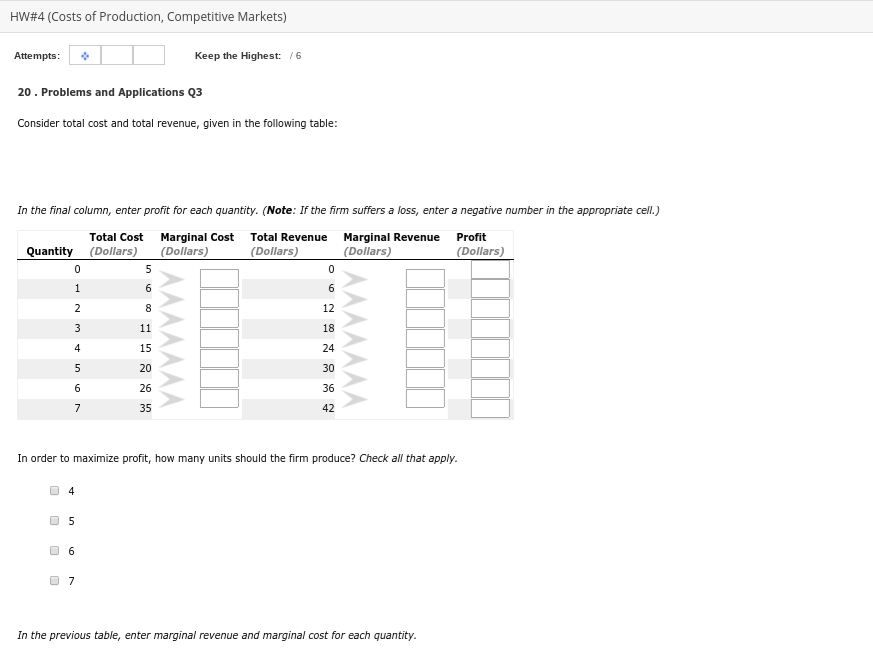
20. Problems and Applications Q3
Consider total cost and total revenue, given in the fllowing table:
In the final column, enter profit for each quantity. (Note: If the firm suffers a loss, enter a negative number in the appropriate cell.)
Total Cost
Quantity (Dollars)
Marginal Cost
Marginal Revenue
(Dollars)
Total Revenue
Profit
(Dollars)
(Dollars)
(Dollars)
12
3
11
18
4
15
24
20
30
26
36
35
42
In order to maximize profit, how many units should the firm produce? Check all that apply.
4
6.
In the previous table, enter marginal revenue and marginal cost for each quantity.
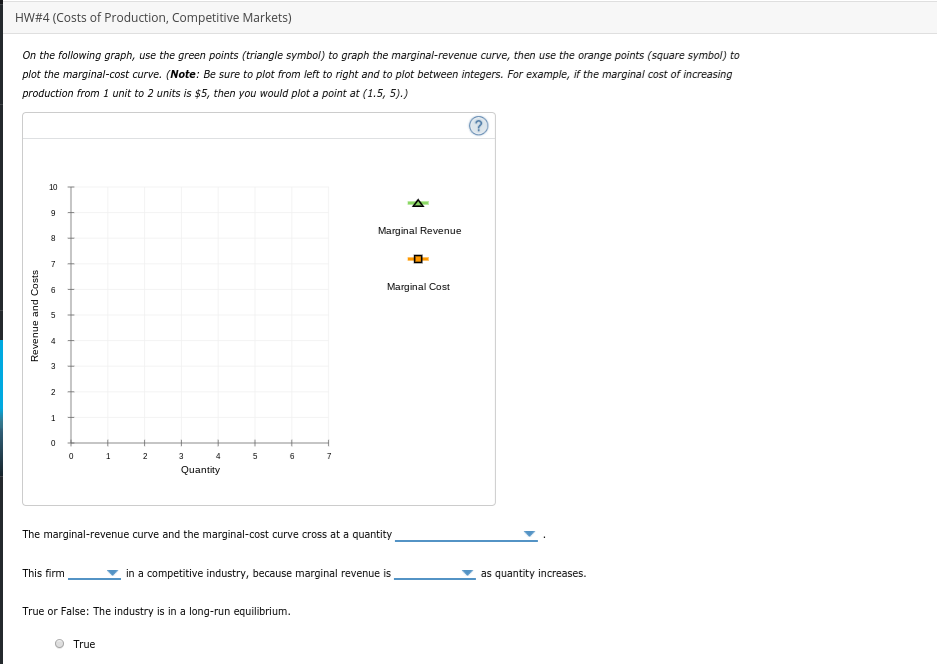
Transcribed Image Text:HW#4 (Costs of Production, Competitive Markets)
On the following graph, use the green points (triangle symbol) to graph the marginal-revenue curve, then use the orange points (square symbol) to
plot the marginal-cost curve. (Note: Be sure to plot from left to right and to plot between integers. For example, if the marginal cost of increasing
production from 1 unit to 2 units is $5, then you would plot a point at (1.5, 5).)
10
Revenue
Marginal Cost
Quantity
The marginal-revenue curve and the marginal-cost curve cross at a quantity
This firm
in a competitive industry, because marginal revenue is
as quantity increases.
True or False: The industry is in a long-run equilibrium.
True
Revenue and Costs
Expert Solution
This question has been solved!
Explore an expertly crafted, step-by-step solution for a thorough understanding of key concepts.

This is a popular solution!

Trending now
This is a popular solution!

Step by step
Solved in 5 steps with 3 images

Recommended textbooks for you
Essentials of Economics (MindTap Course List)
Economics
ISBN:
9781337091992
Author:
N. Gregory Mankiw
Publisher:
Cengage Learning

Principles of Economics, 7th Edition (MindTap Cou…
Economics
ISBN:
9781285165875
Author:
N. Gregory Mankiw
Publisher:
Cengage Learning

Principles of Economics (MindTap Course List)
Economics
ISBN:
9781305585126
Author:
N. Gregory Mankiw
Publisher:
Cengage Learning
Essentials of Economics (MindTap Course List)
Economics
ISBN:
9781337091992
Author:
N. Gregory Mankiw
Publisher:
Cengage Learning
Principles of Economics, 7th Edition (MindTap Cou…
Economics
ISBN:
9781285165875
Author:
N. Gregory Mankiw
Publisher:
Cengage Learning
Principles of Economics (MindTap Course List)
Economics
ISBN:
9781305585126
Author:
N. Gregory Mankiw
Publisher:
Cengage Learning

Managerial Economics: A Problem Solving Approach
Economics
ISBN:
9781337106665
Author:
Luke M. Froeb, Brian T. McCann, Michael R. Ward, Mike Shor
Publisher:
Cengage Learning

