I. Direction: Answer the following problem. 1. Using the following data, perform a one way t-test using a=.05. µ = 10 KSU stats score (X) 10 15 13 5 8 7 9 9 10 13
I. Direction: Answer the following problem. 1. Using the following data, perform a one way t-test using a=.05. µ = 10 KSU stats score (X) 10 15 13 5 8 7 9 9 10 13

Glencoe Algebra 1, Student Edition, 9780079039897, 0079039898, 2018
18th Edition
ISBN:9780079039897
Author:Carter
Publisher:Carter
Chapter10: Statistics
Section10.5: Comparing Sets Of Data
Problem 13PPS

Related questions
Question
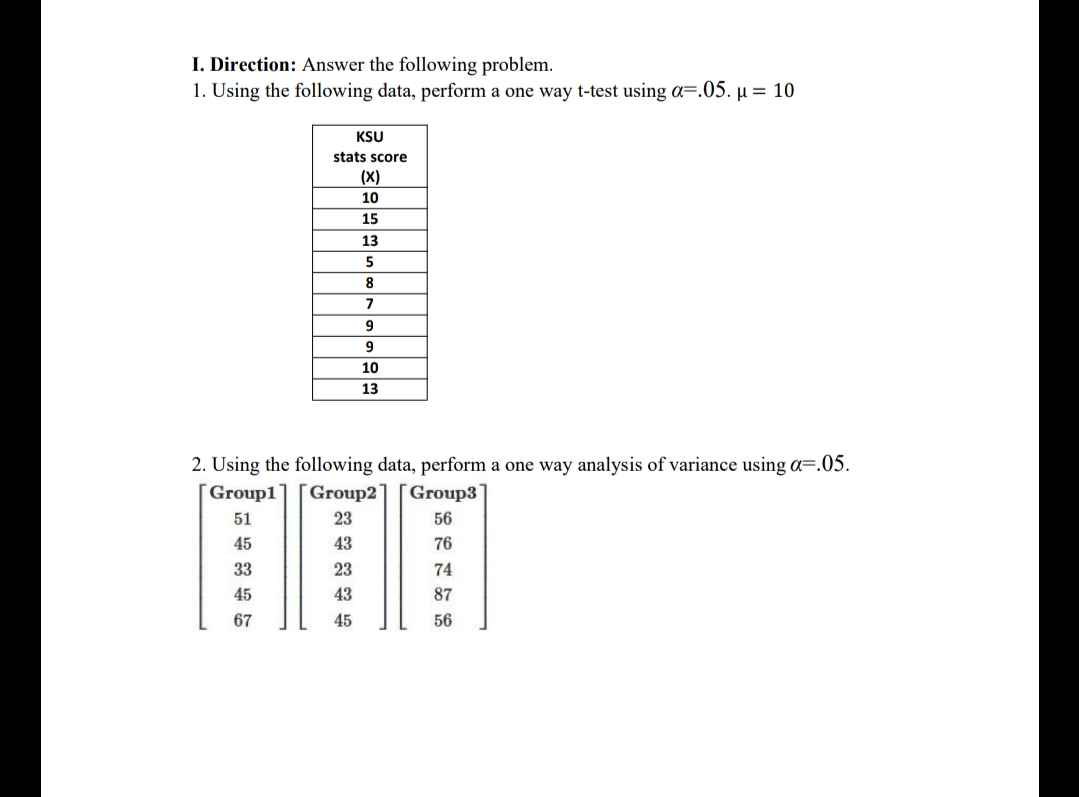
Transcribed Image Text:I. Direction: Answer the following problem.
1. Using the following data, perform a one way t-test using a=.05. µ = 10
KSU
stats score
(X)
10
15
13
5
8
7
9
9
10
13
2. Using the following data, perform a one way analysis of variance using a=.
Group1
Group2
Group3
51
23
56
76
33
74
45
43
87
67
45
56
Expert Solution
This question has been solved!
Explore an expertly crafted, step-by-step solution for a thorough understanding of key concepts.

Step by step
Solved in 2 steps with 2 images

Recommended textbooks for you
Glencoe Algebra 1, Student Edition, 9780079039897…
Algebra
ISBN:
9780079039897
Author:
Carter
Publisher:
McGraw Hill
Glencoe Algebra 1, Student Edition, 9780079039897…
Algebra
ISBN:
9780079039897
Author:
Carter
Publisher:
McGraw Hill