i. Specify the regression model. ii. Interpret the result of the estimated coefficients of this model. iii. What is the coefficient of determination? W hat does this statistic tell you?

College Algebra
7th Edition
ISBN:9781305115545
Author:James Stewart, Lothar Redlin, Saleem Watson
Publisher:James Stewart, Lothar Redlin, Saleem Watson
Chapter1: Equations And Graphs
Section: Chapter Questions
Problem 10T: Olympic Pole Vault The graph in Figure 7 indicates that in recent years the winning Olympic men’s...
icon
Related questions
icon
Concept explainers
Question
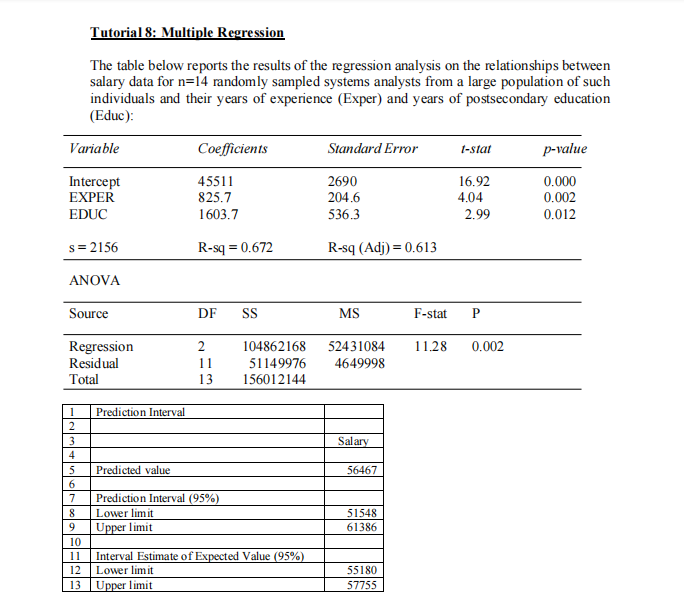
i. Specify the regression model.
ii.
Interpret the result of the estimated coefficients of this model.
III.
What is the coefficient of determination? What does this statistic tell you?
Transcribed Image Text:i. Specify the regression model. ii. Interpret the result of the estimated coefficients of this model. III. What is the coefficient of determination? What does this statistic tell you?
Tutorial 8: Multiple Regression
The table below reports the results of the regression analysis on the relationships between
salary data for n=14 randomly sampled systems analysts from a large population of such
individuals and their years of experience (Exper) and years of postsecondary education
(Educ):
Variable
Coefficients
Standard Error
I-stat
p-value
Intercept
EXPER
2690
204.6
45511
16.92
0.000
825.7
4.04
0.002
EDUC
1603.7
536.3
2.99
0.012
s= 2156
R-sq = 0.672
R-sq (Adj) = 0.613
ANOVA
Source
DF
SS
MS
F-stat
P
0.002
Regression
Residual
Total
2
104862168
52431084
11.28
11
51149976
4649998
13
156012144
Prediction Interval
3
Salary
4
5
Predicted value
56467
6.
7
Prediction Interval (95%)
8
Lower limit
51548
9
Upper limit
61386
10
Interval Estimate of Expected Value (95%)
Lower limit
11
12
55180
13
Upper limit
57755
Transcribed Image Text:Tutorial 8: Multiple Regression The table below reports the results of the regression analysis on the relationships between salary data for n=14 randomly sampled systems analysts from a large population of such individuals and their years of experience (Exper) and years of postsecondary education (Educ): Variable Coefficients Standard Error I-stat p-value Intercept EXPER 2690 204.6 45511 16.92 0.000 825.7 4.04 0.002 EDUC 1603.7 536.3 2.99 0.012 s= 2156 R-sq = 0.672 R-sq (Adj) = 0.613 ANOVA Source DF SS MS F-stat P 0.002 Regression Residual Total 2 104862168 52431084 11.28 11 51149976 4649998 13 156012144 Prediction Interval 3 Salary 4 5 Predicted value 56467 6. 7 Prediction Interval (95%) 8 Lower limit 51548 9 Upper limit 61386 10 Interval Estimate of Expected Value (95%) Lower limit 11 12 55180 13 Upper limit 57755
Expert Solution
steps

Step by step

Solved in 2 steps

Blurred answer
Knowledge Booster
Correlation, Regression, and Association
Learn more about
Need a deep-dive on the concept behind this application? Look no further. Learn more about this topic, statistics and related others by exploring similar questions and additional content below.
Similar questions
  • SEE MORE QUESTIONS
Recommended textbooks for you
College Algebra
College Algebra
Algebra
ISBN:
9781305115545
Author:
James Stewart, Lothar Redlin, Saleem Watson
Publisher:
Cengage Learning
Glencoe Algebra 1, Student Edition, 9780079039897…
Algebra
ISBN:
9780079039897
Author:
Carter
Publisher:
McGraw Hill