
MATLAB: An Introduction with Applications
6th Edition
ISBN: 9781119256830
Author: Amos Gilat
Publisher: John Wiley & Sons Inc
expand_more
expand_more
format_list_bulleted
Related questions
Question
thumb_up100%
Identify the class boundaries ?
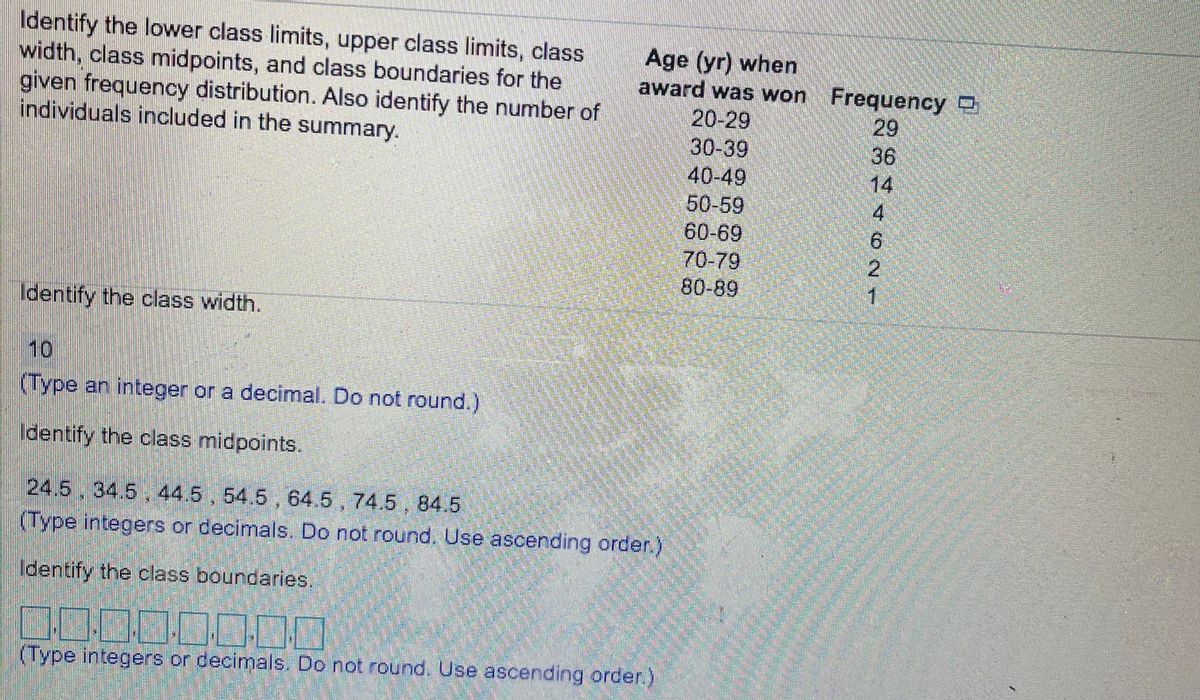

Transcribed Image Text:Identify the lower class limits, upper class limits, class
width, class midpoints, and class boundaries for the
given frequency distribution. Also identify the number of
individuals included in the summary.
Age (yr) when
award was won Frequency D
20-29
30-39
40-49
50-59
60-69
70-79
80-89
29
36
14
4
6.
2.
Identify the class width.
10
(Type an integer or a decimal. Do not round.)
Identify the class midpoints.
24.5. 34.5, 44.5, 54.5, 64.5, 74.5 84.5
(Type integers or decimals. Do not round, Use ascending order.)
Identify the class boundaries,
(Type integers or decimals. Do not round. Use ascending order.)
Expert Solution
This question has been solved!
Explore an expertly crafted, step-by-step solution for a thorough understanding of key concepts.

This is a popular solution

Trending nowThis is a popular solution!

Step by stepSolved in 2 steps

Knowledge Booster


Learn more about
Need a deep-dive on the concept behind this application? Look no further. Learn more about this topic, statistics and related others by exploring similar questions and additional content below.Similar questions
- Proficiency #8. [English Sentences] Which of the following are logically equivalent to the predicate logic statement (Eευ) (p(x) Λ q(x) if U is the set of all owls, p(x) is the statement "x is upset", and q(x) is the statement "x is surprised"? (Choose all that apply): I. There exists a surprised owl who is upset. II. No upset owls are not surprised. III. All surprised owls are upset owls. IV. Some upset owls are surprised owls. V. Not all upset owls are not surprised.arrow_forwardI need answer for iv) v) vi)arrow_forwardtatcrunch 2 Refer to the accompanying data display that results from a sample of airport data speeds in Mbps. Complete parts (a) through (c) below. Click the icon to view at distribution table. W S X H d a. What is the number of degrees of freedom that should be used for finding the critical value t/2? df = 0 (Type a whole number.) b. Find the critical value t/2 corresponding to a 95% confidence level. ¹ x/2 = (Round to two decimal places as needed.) c. Give a brief general description of the number of degrees of freedom. Tech help # 3 OA. The number of degrees of freedom for a collection of sample data is the total number of sample values. OB. The number of degrees of freedom for a collection of sample data is the number of sample values that can vary after certain restrictions have been imposed on all data values. 20 E D с F3 $ 4 888 R F V % 5 T G F5 B MacBook Air Y H 8 7 N F7 TEE U J 00* 8 ►II M F8 9 K O L command F10 P { alt option (13.046,22.15) x=17.598 Sx=16.01712719 n=50 1 Next…arrow_forward
- Eyeglassomatic manufactures eyeglasses for different retailers. They test to see how many defective lenses they made in a time period. The folllowing table gives the type of defect and the number of lenses with that defect. Assume categories are mutually exclusive.arrow_forwardState H0 and what is H1 for all of them a, b and c a) The marketing researcher would like to find out whether consumers from different regions evaluate brand A differently when they see the brand name b) The marketing researcher would like to find out whether consumers from the south region and the north region evaluate brand B differently when they see the brand name c. The data file contains four taste evaluations. The taste evaluations were measured on a scale from 1 to 10 (with 10 the highest evaluation). Brand equity of one brand for one respondent is the difference of branded score and unbranded score of that brand evaluated by the respondent. The marketing researcher would like to find out whether brands A and B have brand equity, in other words, whether the evaluation of brand A (B) is different when consumers can see the brand name vs. when they cannot see the brand name.arrow_forwardThe level of water usage of 250 houses was rated in a survey as low, medium or high and the size of the houses as small, standard or large. The variables,level of water usage and size of house, as recorded in this survey, are a. both numerical variables. b. both categorical variables. c. neither numerical nor categorical variables. d. numerical and categorical variables respectively.arrow_forward
- Two types of categorical variables are a. Nominal and Ordinal b. Descriptive and Numerical c. Categorical and Descriptive d. Categorical and Inferentialarrow_forwardTwo HR managers ranked the 12 entries to hire executives for operations department of a hospital is as follows. What degree of agreement is there between the judges? HR Manager 1 1 2 3 4 5 6 7 8 9 10 11 12 HR Manager 2 12 9 6 10 3 5 4 7 8 2 11 1arrow_forward3. We are interested in seeing if 4-ounce chocolate bars are being accurately created to contain 4-ounces. Random samples of size 6 were taken and weighed. Five hours of observation provided the following data: Sample Меan Range 1 3.91 0.10 I. 4.07 0.16 3.85 0.17 4 4.02 0.19 3.83 0.22 2. 3.arrow_forward
arrow_back_ios
arrow_forward_ios
Recommended textbooks for you
- MATLAB: An Introduction with ApplicationsStatisticsISBN:9781119256830Author:Amos GilatPublisher:John Wiley & Sons Inc
 Probability and Statistics for Engineering and th...StatisticsISBN:9781305251809Author:Jay L. DevorePublisher:Cengage Learning
 Statistics for The Behavioral Sciences (MindTap C...StatisticsISBN:9781305504912Author:Frederick J Gravetter, Larry B. WallnauPublisher:Cengage Learning
  Elementary Statistics: Picturing the World (7th E...StatisticsISBN:9780134683416Author:Ron Larson, Betsy FarberPublisher:PEARSON
 The Basic Practice of StatisticsStatisticsISBN:9781319042578Author:David S. Moore, William I. Notz, Michael A. FlignerPublisher:W. H. Freeman
 Introduction to the Practice of StatisticsStatisticsISBN:9781319013387Author:David S. Moore, George P. McCabe, Bruce A. CraigPublisher:W. H. Freeman
MATLAB: An Introduction with Applications
Statistics
ISBN:9781119256830
Author:Amos Gilat
Publisher:John Wiley & Sons Inc
Probability and Statistics for Engineering and th...
Statistics
ISBN:9781305251809
Author:Jay L. Devore
Publisher:Cengage Learning
Statistics for The Behavioral Sciences (MindTap C...
Statistics
ISBN:9781305504912
Author:Frederick J Gravetter, Larry B. Wallnau
Publisher:Cengage Learning
Elementary Statistics: Picturing the World (7th E...
Statistics
ISBN:9780134683416
Author:Ron Larson, Betsy Farber
Publisher:PEARSON
The Basic Practice of Statistics
Statistics
ISBN:9781319042578
Author:David S. Moore, William I. Notz, Michael A. Fligner
Publisher:W. H. Freeman
Introduction to the Practice of Statistics
Statistics
ISBN:9781319013387
Author:David S. Moore, George P. McCabe, Bruce A. Craig
Publisher:W. H. Freeman