
MATLAB: An Introduction with Applications
6th Edition
ISBN: 9781119256830
Author: Amos Gilat
Publisher: John Wiley & Sons Inc
expand_more
expand_more
format_list_bulleted
Related questions
Question
Identify the upper class limits ?
Identify the class width ?
Identify the class midpoints ?
Identify the class boundaries ?
Identify the number of individuals included in the summary ?

Transcribed Image Text:ne (yr) when
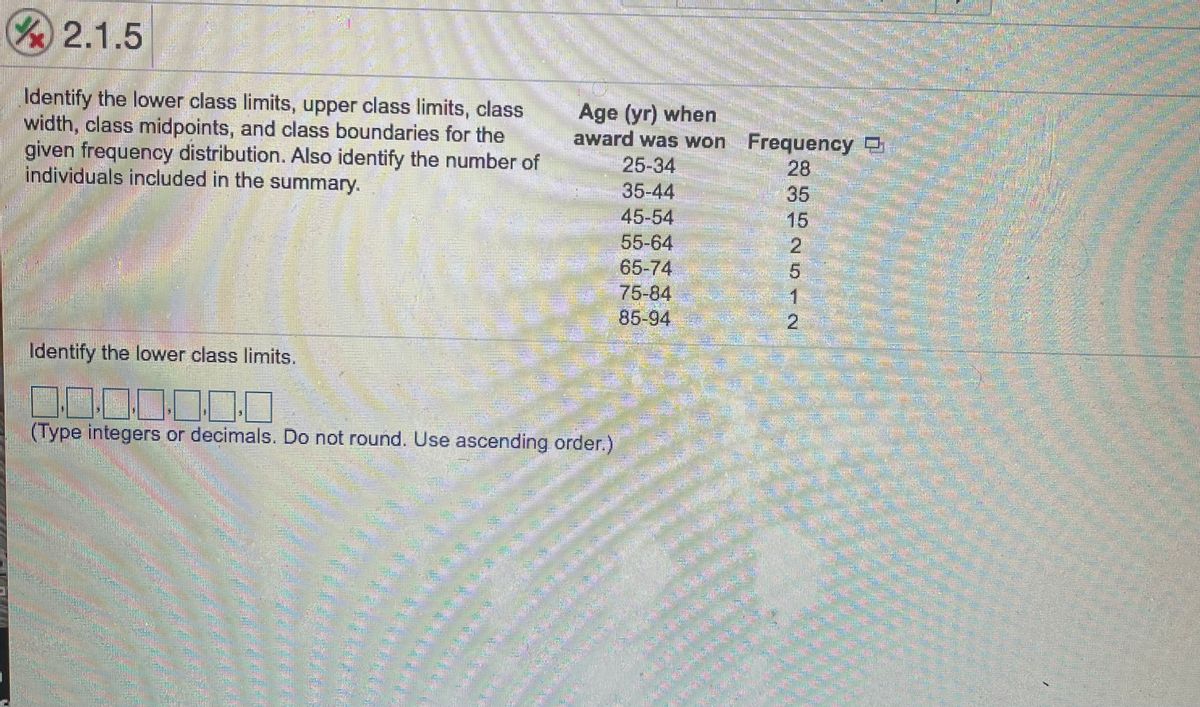
Age (yr) when
award was won Frequency
25-34
35-44
45-54
55-64
65-74
75-84
85-94
Identify the lower class limits, upper class limits, class
width, class midpoints, and class boundaries for the
given frequency distribution. Also identify the number of
individuals included in the summary.
28
35
15
12
1
Identify the lower class limits.
000
(Type integers or decimals. Do not round. Use ascending order.)
Expert Solution
This question has been solved!
Explore an expertly crafted, step-by-step solution for a thorough understanding of key concepts.

This is a popular solution

Trending nowThis is a popular solution!

Step by stepSolved in 2 steps

Knowledge Booster


Learn more about
Need a deep-dive on the concept behind this application? Look no further. Learn more about this topic, statistics and related others by exploring similar questions and additional content below.Similar questions
- Classify each of the following as nominal, ordinal, interval, or ratio data and explain. a. the time required to produce each car on an assembly line. b. the number of litres of water a family drinks in a month. c. the ranking of four student projects in your class after they have been designated as excellent, good, satisfactory, and poor. d. the telephone area code of clients in India. e. Explain the four groups of data in detail.arrow_forwardSelect the correct answer and write the appropriate letter in the space provided _____ 1. A grouping of data into classes giving the number of observations in each class is called a(an) a bar chart. b. frequency distribution. c. pie chart. d. cumulative frequency distribution. ______ 2. The distance between consecutive lower class limits is called the a. class interval. b. frequency distribution. c. class midpoint. d. class frequency. ______ 3. The class midpoint is a. equal to the number of observations. b. found by adding the lower class limits of two consecutive classes and dividing by 2. c. equal to the class interval. d. all of the above. ______ 4. The number of observations in a particular class is called the a. class interval. b. class frequency. c. frequency distribution. d. none of the above. ______ 5. A bar chart is used most often when a. you want to show frequencies as compared to total observations. b. you want to show…arrow_forwardDetermine whether the statement is true or false. If it is false, rewrite it as a true statement. The midpoint of a class is the sum of its lower and upper limits divided by two. Choose the correct answer below. OA. The statement is false. A true statement is "The midpoint of a class is the class frequency divided by the sample size." B. The statement is false. A true statement is "The midpoint of a class is the average of its lower and upper limits." OC. The statement is false. A true statement is "The midpoint of a class is the difference of its lower and upper limits divided by two." O D. The statement is true.arrow_forward
- Determine whether the statement is true or false. If it is false, rewrite it as a true statement. A population is the collection of some outcomes, responses, measurements, or counts that are of interest. Choose the correct answer below. A. True. B. False. A sample is the collection of all outcomes, responses, measurements, or counts that are of interest. C. False. A population is the collection of all outcomes, responses, measurements, or counts that are of interest.arrow_forwardGiven the data below; 320,332,339,343,345,348,351,352,364,376. a) find the mode.arrow_forward
arrow_back_ios
arrow_forward_ios
Recommended textbooks for you
- MATLAB: An Introduction with ApplicationsStatisticsISBN:9781119256830Author:Amos GilatPublisher:John Wiley & Sons Inc
 Probability and Statistics for Engineering and th...StatisticsISBN:9781305251809Author:Jay L. DevorePublisher:Cengage Learning
 Statistics for The Behavioral Sciences (MindTap C...StatisticsISBN:9781305504912Author:Frederick J Gravetter, Larry B. WallnauPublisher:Cengage Learning
  Elementary Statistics: Picturing the World (7th E...StatisticsISBN:9780134683416Author:Ron Larson, Betsy FarberPublisher:PEARSON
 The Basic Practice of StatisticsStatisticsISBN:9781319042578Author:David S. Moore, William I. Notz, Michael A. FlignerPublisher:W. H. Freeman
 Introduction to the Practice of StatisticsStatisticsISBN:9781319013387Author:David S. Moore, George P. McCabe, Bruce A. CraigPublisher:W. H. Freeman
MATLAB: An Introduction with Applications
Statistics
ISBN:9781119256830
Author:Amos Gilat
Publisher:John Wiley & Sons Inc
Probability and Statistics for Engineering and th...
Statistics
ISBN:9781305251809
Author:Jay L. Devore
Publisher:Cengage Learning
Statistics for The Behavioral Sciences (MindTap C...
Statistics
ISBN:9781305504912
Author:Frederick J Gravetter, Larry B. Wallnau
Publisher:Cengage Learning
Elementary Statistics: Picturing the World (7th E...
Statistics
ISBN:9780134683416
Author:Ron Larson, Betsy Farber
Publisher:PEARSON
The Basic Practice of Statistics
Statistics
ISBN:9781319042578
Author:David S. Moore, William I. Notz, Michael A. Fligner
Publisher:W. H. Freeman
Introduction to the Practice of Statistics
Statistics
ISBN:9781319013387
Author:David S. Moore, George P. McCabe, Bruce A. Craig
Publisher:W. H. Freeman