
MATLAB: An Introduction with Applications
6th Edition
ISBN: 9781119256830
Author: Amos Gilat
Publisher: John Wiley & Sons Inc
expand_more
expand_more
format_list_bulleted
Related questions
Question
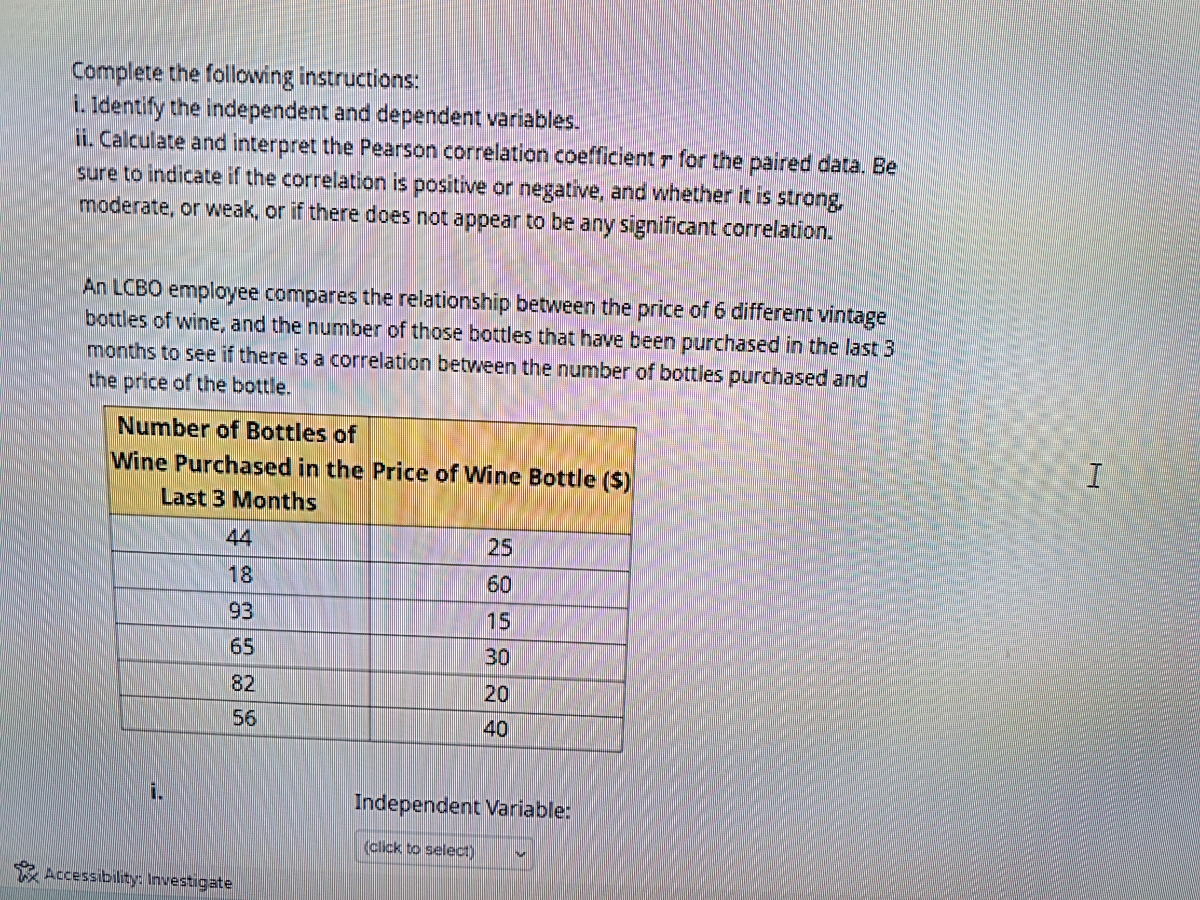

Transcribed Image Text:Complete the following instructions:
i. Identify the independent and dependent variables.
ii. Calculate and interpret the Pearson correlation coefficient r for the paired data. Be
sure to indicate if the correlation is positive or negative, and whether it is strong,
moderate, or weak, or if there does not appear to be any significant correlation.
An LCBO employee compares the relationship between the price of 6 different vintage
bottles of wine, and the number of those bottles that have been purchased in the last 3
months to see if there is a correlation between the number of bottles purchased and
the price of the bottle.
Number of Bottles of
Wine Purchased in the Price of Wine Bottle ($)
Last 3 Months
i
44
18
93
65
82
56
Accessibility: Investigate
25
60
15
30
20
40
Independent Variable:
(click to select)
I

Transcribed Image Text:Ons: On
1.
ii.
Accessibility: Investigate
Independent Variable:
(click to select)
Dependent Variable:
(click to select)
Pearson Correlation Coefficient ():
Round to 3 decimal places.
Correlation:
(click to select)
Correlation Strength:
(click to select)
Expert Solution
This question has been solved!
Explore an expertly crafted, step-by-step solution for a thorough understanding of key concepts.

Step by stepSolved in 2 steps with 1 images

Knowledge Booster

Similar questions
- Match the linear correlation coefficient to the scatter diagram. The scales on the x- and y-axis are the same for each scatter diagram. (a) r= - 0.049, (b) r= - 1, (c) r= - 0.810 ..... Explanatory (a) Scatter diagram II (b) Scatter diagram III (c) Scatter diagram Explanatory II Explanatory .... Response Response asuodsayarrow_forwardWhen calculating a correlation coefficient between two continuous variables, the scales on which the variables are measured affect the value of the correlation coefficient. True or Falsearrow_forwardestion 3 of 38 university and gathers their freshman year GPA data and the high school SAI score reported on each of their college applications. He produces a scatterplot with SAT scores on the horizontal axis and GPA on the vertical axis. The data has a linear correlation coefficient of 0.506701. Additional sample statistics are summarized in the table below. Variable Sample Sample standard Variable description mean deviation high school SAT score x 1504.291401 Sx = 105.782904 %3D y freshman year GPA y = 3.240805 Sy = 0.441205 r = 0.506701 slope 0.002113 Determine the y-intercept, a, of the least-squares regression line for this data. Give your answer precise to at least four decimal places. tems of use Thelp about us குசங் careers 2:30 PM 10/24/20 o耳 国 @ hparrow_forward
- What is the correlation coefficient (r) for the best data setarrow_forwardThe degrees of freedom of correlation test is determined by what?arrow_forwardSuppose the correlation coefficient r=0.16 Find:a. The coefficient of determination r2= (round to 3 decimal places)b. The percentage of explained variation = % (round to 1 decimal place)c. The percentage of unexplained variation = % (round to 1 decimal place)arrow_forward
- Part A: What is the most likely value of the correlation coefficient of the data in the table? Based on the correlation coefficient, describe the relationship between time and surface area of the lake. [Choose the value of the correlation coefficient from −1, −0.98, −0.5, −0.02.] Part B: What is the value of the slope of the graph of surface area versus time between 15 and 20 days, and what does the slope represent? Part C: Does the data in the table represent correlation or causation? Explain your answer.arrow_forwardIf the correlation coefficient r is equal to 0.585, find the coefficient if determination and the coefficient of no determinationarrow_forwardcalculate the correlation coefficient to three decimal places, x is 4,5,6,7,8,9, y, 6.05,8.64,3.93,4.92,2.31,4arrow_forward
arrow_back_ios
SEE MORE QUESTIONS
arrow_forward_ios
Recommended textbooks for you
- MATLAB: An Introduction with ApplicationsStatisticsISBN:9781119256830Author:Amos GilatPublisher:John Wiley & Sons Inc
 Probability and Statistics for Engineering and th...StatisticsISBN:9781305251809Author:Jay L. DevorePublisher:Cengage Learning
 Statistics for The Behavioral Sciences (MindTap C...StatisticsISBN:9781305504912Author:Frederick J Gravetter, Larry B. WallnauPublisher:Cengage Learning
  Elementary Statistics: Picturing the World (7th E...StatisticsISBN:9780134683416Author:Ron Larson, Betsy FarberPublisher:PEARSON
 The Basic Practice of StatisticsStatisticsISBN:9781319042578Author:David S. Moore, William I. Notz, Michael A. FlignerPublisher:W. H. Freeman
 Introduction to the Practice of StatisticsStatisticsISBN:9781319013387Author:David S. Moore, George P. McCabe, Bruce A. CraigPublisher:W. H. Freeman
MATLAB: An Introduction with Applications
Statistics
ISBN:9781119256830
Author:Amos Gilat
Publisher:John Wiley & Sons Inc
Probability and Statistics for Engineering and th...
Statistics
ISBN:9781305251809
Author:Jay L. Devore
Publisher:Cengage Learning
Statistics for The Behavioral Sciences (MindTap C...
Statistics
ISBN:9781305504912
Author:Frederick J Gravetter, Larry B. Wallnau
Publisher:Cengage Learning
Elementary Statistics: Picturing the World (7th E...
Statistics
ISBN:9780134683416
Author:Ron Larson, Betsy Farber
Publisher:PEARSON
The Basic Practice of Statistics
Statistics
ISBN:9781319042578
Author:David S. Moore, William I. Notz, Michael A. Fligner
Publisher:W. H. Freeman
Introduction to the Practice of Statistics
Statistics
ISBN:9781319013387
Author:David S. Moore, George P. McCabe, Bruce A. Craig
Publisher:W. H. Freeman