III UU1% levei O A. I, II, and II. O B. I only OC. II only O D. I and I1 Construct a 95% confidence interval for the effect of gender gap The 95% confidence interval for the effect of gender gap is ( D. (Round your responses to two decimal places) From the sample, the average wage of women is $ per hour (Round your response to three decimal places) From the sample, the average wage of men is $ per hour. (Round your response to three decimal places) Another researcher uses these same data but regresses Wages on Female, a variable that is equal to 1 if the person is female and 0f the person a male What are the regression estmates calcaled bom this gressen? Wage = Yo + Y XFemale, R SER Yo - (Round your response to three decimal places) Y. (Round your response to three decimal places) R (Round your response to two decimal places) SER - (Round your response to one decimal place) Click to select your answer(s).
III UU1% levei O A. I, II, and II. O B. I only OC. II only O D. I and I1 Construct a 95% confidence interval for the effect of gender gap The 95% confidence interval for the effect of gender gap is ( D. (Round your responses to two decimal places) From the sample, the average wage of women is $ per hour (Round your response to three decimal places) From the sample, the average wage of men is $ per hour. (Round your response to three decimal places) Another researcher uses these same data but regresses Wages on Female, a variable that is equal to 1 if the person is female and 0f the person a male What are the regression estmates calcaled bom this gressen? Wage = Yo + Y XFemale, R SER Yo - (Round your response to three decimal places) Y. (Round your response to three decimal places) R (Round your response to two decimal places) SER - (Round your response to one decimal place) Click to select your answer(s).

MATLAB: An Introduction with Applications
6th Edition
ISBN:9781119256830
Author:Amos Gilat
Publisher:Amos Gilat
Chapter1: Starting With Matlab
Section: Chapter Questions
Problem 1P

Related questions
Topic Video
Question
100%
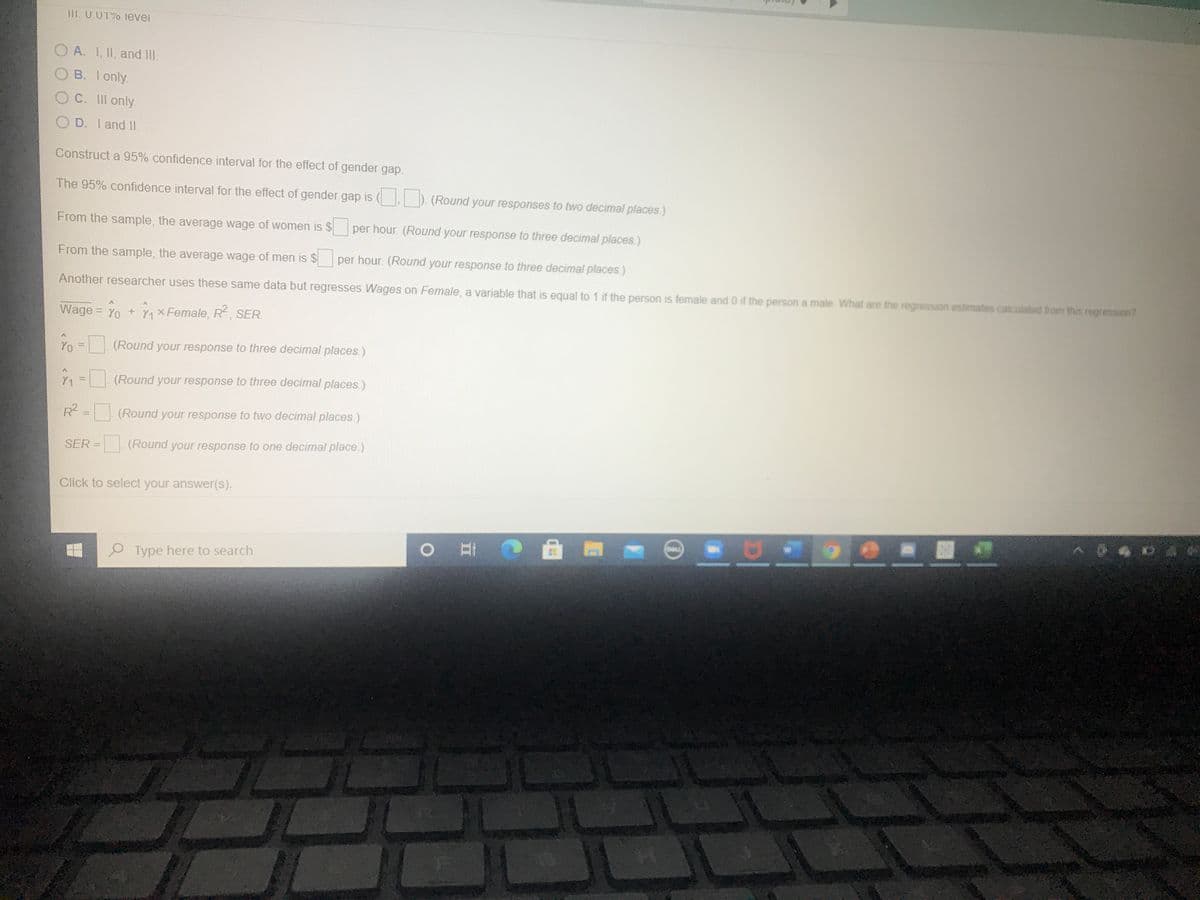
Transcribed Image Text:111. U.01% levei
O A. I, II, and II.
B. Ionly.
C. II only.
O D. I and I.
Construct a 95% confidence interval for the effect of gender gap.
The 95% confidence interval for the effect of gender gap is ( ). (Round your responses to two decimal places.)
From the sample, the average wage of women is $ per hour. (Round your response to three decimal places.)
From the sample, the average wage of men is $
per hour. (Round your response to three decimal places.)
Another researcher uses these same data but regresses Wages on Female, a variable that is equal to 1 if the person is female and 0 if the person a male What are the regression estimates calculated from this regression?
Wage = Yo + nxFemale, R, SER.
Yo = (Round your response to three decimal places.)
%3D
Y1 = (Round your response to three decimal places.)
%3D
R = (Round your response to two decimal places.)
SER = (Round your response to one decimal place.)
Click to select your answer(s).
...
O Type here to search
Transcribed Image Text:11 of 21 (9 complete)
TH
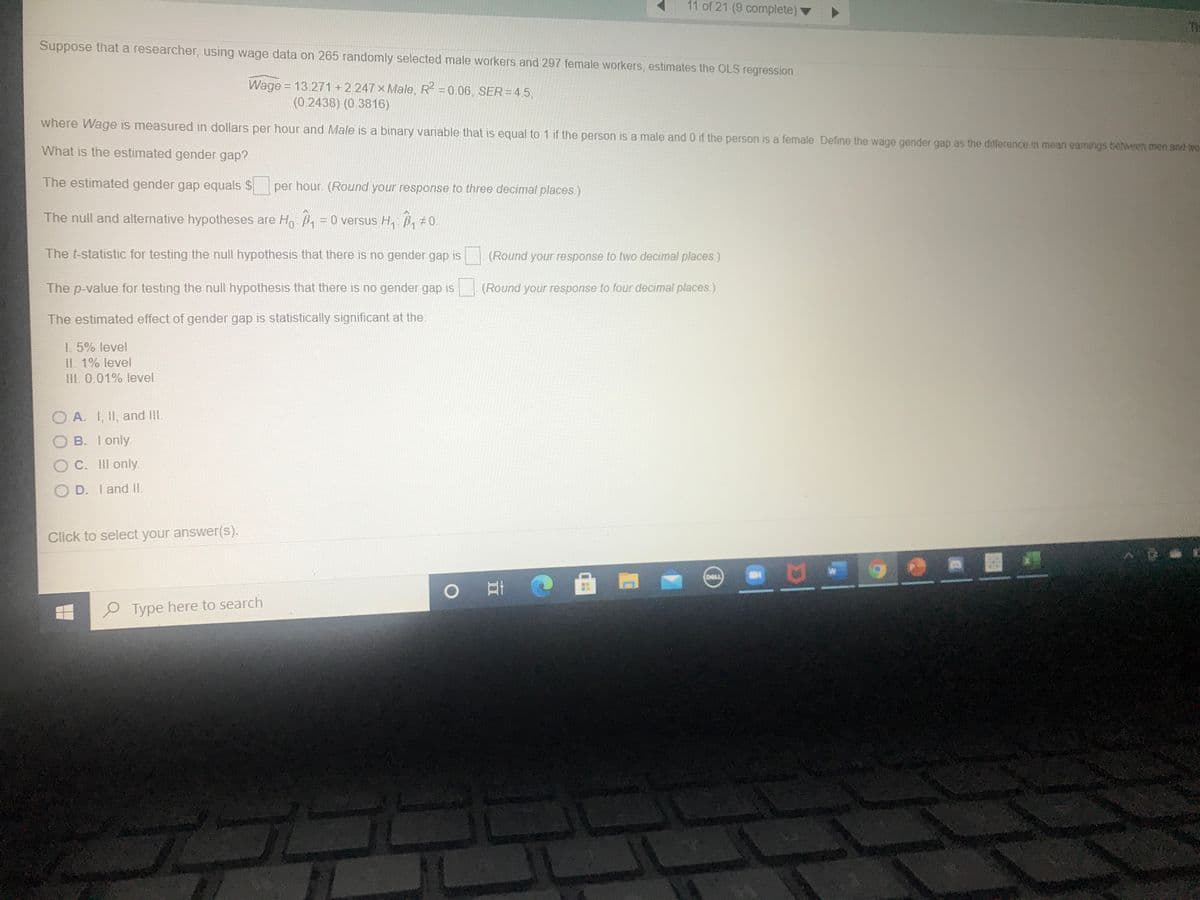
Suppose that a researcher, using wage data on 265 randomly selected male workers and 297 female workers, estimates the OLS regression
Wage = 13.271 +2.247 x Male, R2 =0.06, SER=45,
(0.2438) (0.3816)
where Wage is measured in dollars per hour and Male is a binary variable that is equal to 1 if the person is a male and 0 if the person is a female. Define the wage gender gap as the difference in mean eamings between men and we
What is the estimated gender gap?
The estimated gender gap equals $ per hour. (Round your response to three decimal places.)
The null and alternative hypotheses are Ho B = 0 versus H, B, #0.
The t-statistic for testing the null hypothesis that there is no gender gap is
(Round your response to two decimal places.)
The p-value for testing the null hypothesis that there is no gender gap is (Round your response to four decimal places.)
The estimated effect of gender gap is statistically significant at the:
1. 5% level
II. 1% level
III. 0.01% level
O A. I, II, and II.
O B. I only.
OC. III only.
O D. I and II.
Click to select your answer(S).
(DELL
P Type here to search
Expert Solution
This question has been solved!
Explore an expertly crafted, step-by-step solution for a thorough understanding of key concepts.

This is a popular solution!

Trending now
This is a popular solution!

Step by step
Solved in 2 steps with 1 images

Knowledge Booster


Learn more about
Need a deep-dive on the concept behind this application? Look no further. Learn more about this topic, statistics and related others by exploring similar questions and additional content below.Recommended textbooks for you
MATLAB: An Introduction with Applications
Statistics
ISBN:
9781119256830
Author:
Amos Gilat
Publisher:
John Wiley & Sons Inc

Probability and Statistics for Engineering and th…
Statistics
ISBN:
9781305251809
Author:
Jay L. Devore
Publisher:
Cengage Learning

Statistics for The Behavioral Sciences (MindTap C…
Statistics
ISBN:
9781305504912
Author:
Frederick J Gravetter, Larry B. Wallnau
Publisher:
Cengage Learning
MATLAB: An Introduction with Applications
Statistics
ISBN:
9781119256830
Author:
Amos Gilat
Publisher:
John Wiley & Sons Inc
Probability and Statistics for Engineering and th…
Statistics
ISBN:
9781305251809
Author:
Jay L. Devore
Publisher:
Cengage Learning
Statistics for The Behavioral Sciences (MindTap C…
Statistics
ISBN:
9781305504912
Author:
Frederick J Gravetter, Larry B. Wallnau
Publisher:
Cengage Learning

Elementary Statistics: Picturing the World (7th E…
Statistics
ISBN:
9780134683416
Author:
Ron Larson, Betsy Farber
Publisher:
PEARSON

The Basic Practice of Statistics
Statistics
ISBN:
9781319042578
Author:
David S. Moore, William I. Notz, Michael A. Fligner
Publisher:
W. H. Freeman

Introduction to the Practice of Statistics
Statistics
ISBN:
9781319013387
Author:
David S. Moore, George P. McCabe, Bruce A. Craig
Publisher:
W. H. Freeman