In a test of weight loss programs, 186 subjects were divided such that 31 subjects followed each of 6 diets. Each was weighed a year after starting the diet and the results are in the ANOVA table below. Use a 0.025 significance level to test the claim that the mean weight loss is the same for the different diets. Source of Variation Between Groups Within Groups Total df MS F crit P-value 1.5004 0.191842 2.637633 F 255.292 5 6125.386 6380.678 51.05849 180 34.02992 185 Should the null hypothesis that all the diets have the same mean weight loss be rejected? O A. Yes, because the P-value is greater than the significance level. O B. No, because the P-value is less than the significance level. O C. No, because the P-value is greater than the significance level. O D. Yes, because the P-value is less than the significance level.
In a test of weight loss programs, 186 subjects were divided such that 31 subjects followed each of 6 diets. Each was weighed a year after starting the diet and the results are in the ANOVA table below. Use a 0.025 significance level to test the claim that the mean weight loss is the same for the different diets. Source of Variation Between Groups Within Groups Total df MS F crit P-value 1.5004 0.191842 2.637633 F 255.292 5 6125.386 6380.678 51.05849 180 34.02992 185 Should the null hypothesis that all the diets have the same mean weight loss be rejected? O A. Yes, because the P-value is greater than the significance level. O B. No, because the P-value is less than the significance level. O C. No, because the P-value is greater than the significance level. O D. Yes, because the P-value is less than the significance level.

College Algebra (MindTap Course List)
12th Edition
ISBN:9781305652231
Author:R. David Gustafson, Jeff Hughes
Publisher:R. David Gustafson, Jeff Hughes
Chapter8: Sequences, Series, And Probability
Section8.7: Probability
Problem 58E: What is meant by the sample space of an experiment?

Related questions
Topic Video
Question
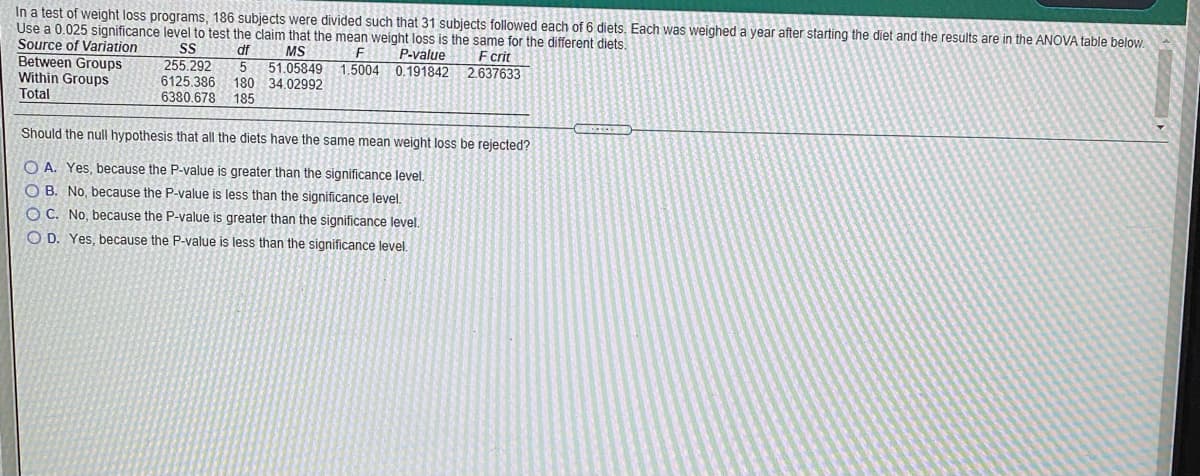
Transcribed Image Text:In a test of weight loss programs, 186 subjects were divided such that 31 subjects followed each of 6 diets. Each was weighed a year after starting the diet and the results are in the ANOVA table below.
Use a 0.025 significance level to test the claim that the mean weight loss is the same for the different diets.
Source of Variation
Between Groups
Within Groups
P-value F crit
df
51.05849
180 34.02992
185
MS
255.292
6125.386
6380,678
5
1.5004 0.191842 2.637633
Total
Should the null hypothesis that all the diets have the same mean weight loss be rejected?
O A. Yes, because the P-value is greater than the significance level.
O B. No, because the P-value is less than the significance level.
O C. No, because the P-value is greater than the significance level.
O D. Yes, because the P-value is less than the significance level.
Expert Solution
This question has been solved!
Explore an expertly crafted, step-by-step solution for a thorough understanding of key concepts.

This is a popular solution!

Trending now
This is a popular solution!

Step by step
Solved in 2 steps

Knowledge Booster


Learn more about
Need a deep-dive on the concept behind this application? Look no further. Learn more about this topic, statistics and related others by exploring similar questions and additional content below.Recommended textbooks for you
College Algebra (MindTap Course List)
Algebra
ISBN:
9781305652231
Author:
R. David Gustafson, Jeff Hughes
Publisher:
Cengage Learning
College Algebra (MindTap Course List)
Algebra
ISBN:
9781305652231
Author:
R. David Gustafson, Jeff Hughes
Publisher:
Cengage Learning