In Problems, a.identify the population and variable under consideration. b.use the technology of your choice to obtain and interpret a frequency histogram, a relative-frequency histogram, or a percent histogram of the data. c.use the technology of your choice to obtain a dotplot of the data. d.use the technology of your choice to obtain a stem-and-leaf diagram of the data. e.identify the modality and symmetry (or nonsymmetry) of the distribution. f.if the distribution is unimodal and nonsymmetric, state whether it is right skewed or left skewed.Agricultural Exports. The U.S. Department of Agriculture collects data pertaining to the value of agricultural exports and publishes its findings in U.S. Agricultural Trade Update. For one year, the values of these exports, by state, are provided on the WeissStats site. Data are in millions of dollars.


In Problems,
a.identify the population and variable under consideration.
b.use the technology of your choice to obtain and interpret a frequency histogram, a relative-frequency histogram, or a percent histogram of the data.
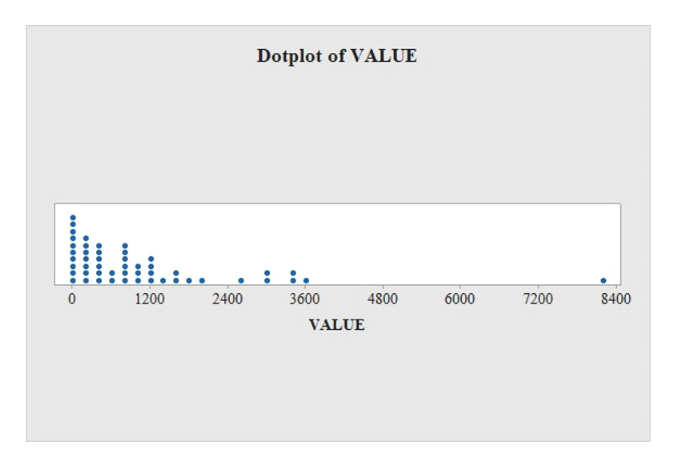
c.use the technology of your choice to obtain a dotplot of the data.
d.use the technology of your choice to obtain a stem-and-leaf diagram of the data.
e.identify the modality and symmetry (or nonsymmetry) of the distribution.
f.if the distribution is unimodal and nonsymmetric, state whether it is right skewed or left skewed.
Agricultural Exports. The U.S. Department of Agriculture collects data pertaining to the value of agricultural exports and publishes its findings in U.S. Agricultural Trade Update. For one year, the values of these exports, by state, are provided on the WeissStats site. Data are in millions of dollars.
(a)
Justification:
Population and variable:
The complete set of observations for a particular study that can be studied is called a ‘Population’. Each observation of population is defined as population unit and the population data have the variable values for the whole population whereas the part is considered to be the variable.
Thus, the states of the United States are the population and the variable is exports values of the States.
(b)
Software procedure:
Step by step procedure to draw the relative frequency histogram chart by using MINITAB software.
- Choose Graph > Histogram.
- Choose Simple, and then click OK.
- In Graph variables, enter the corresponding column of values.
- In scale on y-axis, make click on frequency.
- Click on ok.
Output using MINITAB software is given below:
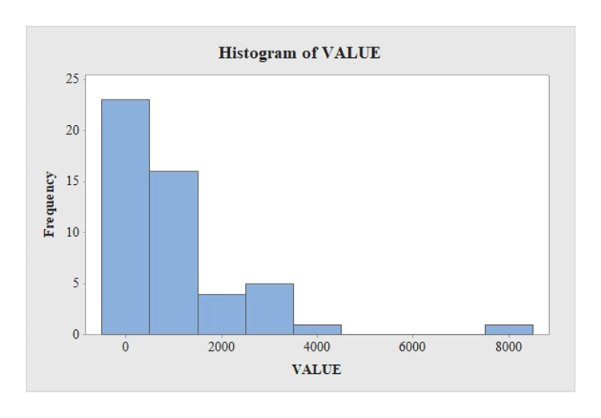
Interpretation:
The pattern in the graph is the data is more in the value zero which is approximately frequency of about 22.
(c)
Software procedure:
Step-by-step procedure to draw dot plot using MINITAB software is as follows:
- Select Graph > Dot plot.
- Select the column of values in Graph variables.
- Select OK.
Output using MINITAB software is given below:

Trending now
This is a popular solution!

Step by step
Solved in 4 steps with 3 images


