Problem 4. In 2009 the LA Times Data Desk started its "Mapping LA" project, which included collecting information about all 114 distinct neighborhoods of the city of Los Angeles. The dataset we will work with in Problems 4-7 includes the 104 neighborhoods that, as of 2008, had at least one public school in the neighborhood. Here is some important information about the variables in the dataset: . Neighborhood: the name of the neighborhood * Income: the median income of the neighborhood's residents, in thousands of dollars . Schools: the median API score of schools in the neighborhood, measured on a scale from 2000 (bad) to 1000 (good) Asian corresponds to Asian 5) measured on a scale from 1 (not diverse at all) to 10 (very diverse) · Asian, Black, Latino, white: the percentage of residents with each of those ethnicities (i.e.,5% . Diversity: how likely neighborhood residents are to encounter a resident of a different ethnicity, . Population: the neighborhood's population, according to the 2000 U.S. Census, in thousands How many cases are in this dataset? Which variable is the label variable? categorica iable (circle one)? Is population a quantitative Was this dataset collected from an observational study (circle one)? experiment Which of the following plots would be useful for identifying the distribution of Income: (circle one)? histogram scatter plot pie chart
Problem 4. In 2009 the LA Times Data Desk started its "Mapping LA" project, which included collecting information about all 114 distinct neighborhoods of the city of Los Angeles. The dataset we will work with in Problems 4-7 includes the 104 neighborhoods that, as of 2008, had at least one public school in the neighborhood. Here is some important information about the variables in the dataset: . Neighborhood: the name of the neighborhood * Income: the median income of the neighborhood's residents, in thousands of dollars . Schools: the median API score of schools in the neighborhood, measured on a scale from 2000 (bad) to 1000 (good) Asian corresponds to Asian 5) measured on a scale from 1 (not diverse at all) to 10 (very diverse) · Asian, Black, Latino, white: the percentage of residents with each of those ethnicities (i.e.,5% . Diversity: how likely neighborhood residents are to encounter a resident of a different ethnicity, . Population: the neighborhood's population, according to the 2000 U.S. Census, in thousands How many cases are in this dataset? Which variable is the label variable? categorica iable (circle one)? Is population a quantitative Was this dataset collected from an observational study (circle one)? experiment Which of the following plots would be useful for identifying the distribution of Income: (circle one)? histogram scatter plot pie chart

MATLAB: An Introduction with Applications
6th Edition
ISBN:9781119256830
Author:Amos Gilat
Publisher:Amos Gilat
Chapter1: Starting With Matlab
Section: Chapter Questions
Problem 1P

Related questions
Question
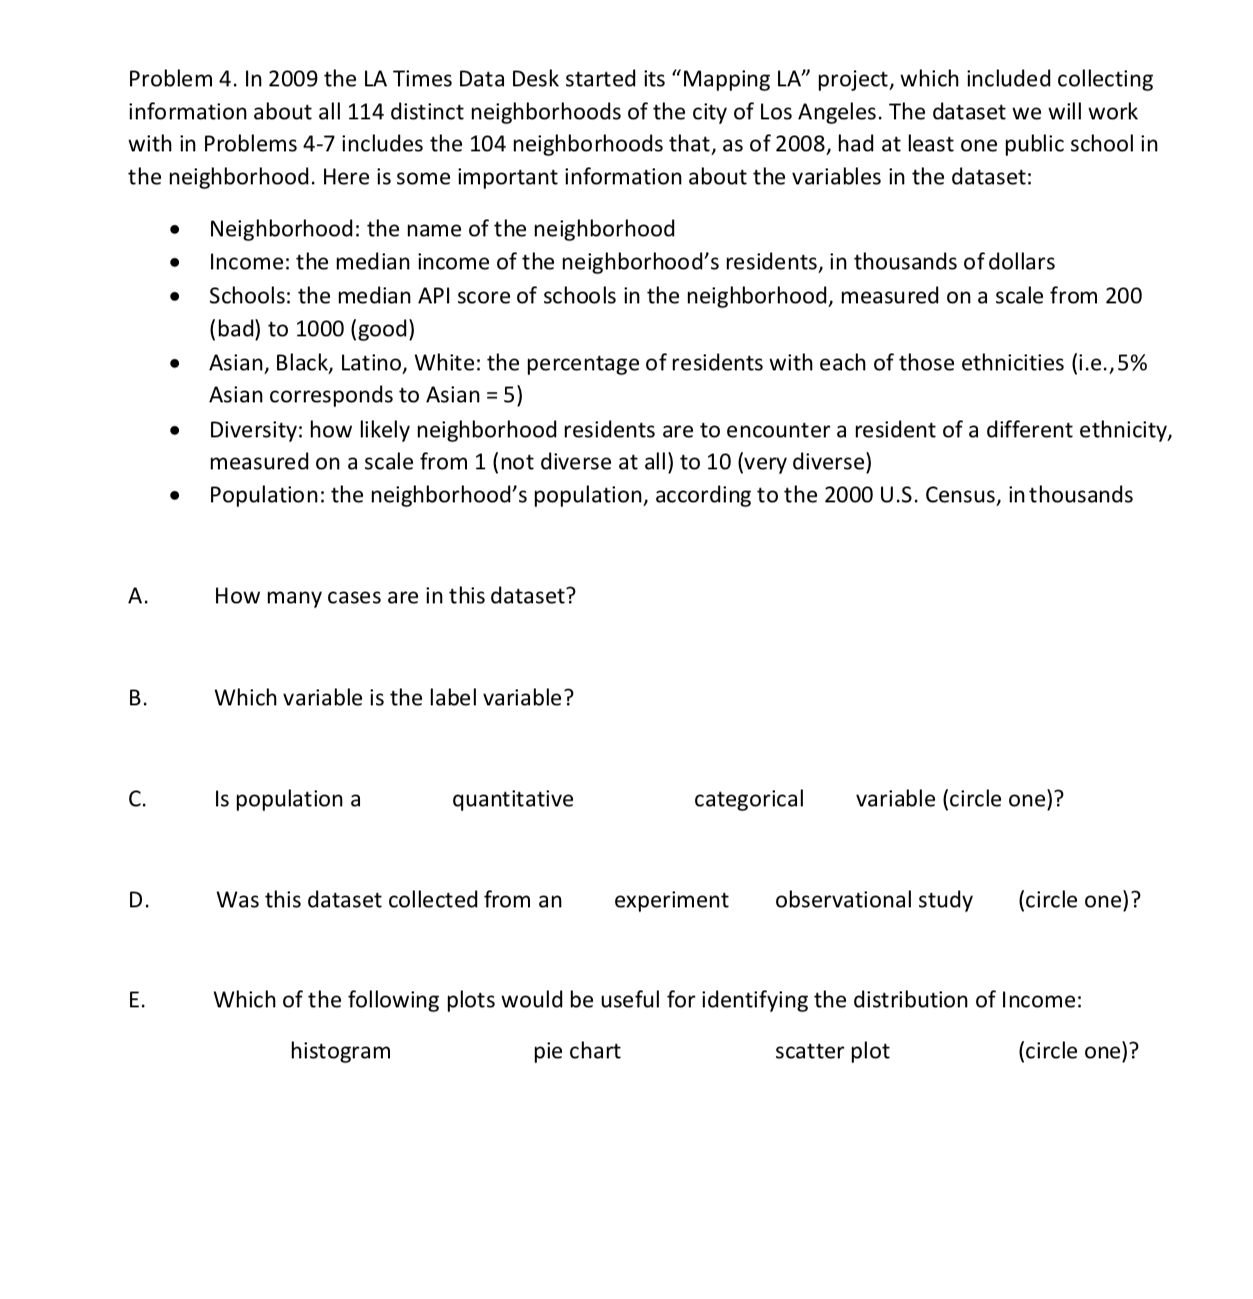
Transcribed Image Text:Problem 4. In 2009 the LA Times Data Desk started its "Mapping LA" project, which included collecting
information about all 114 distinct neighborhoods of the city of Los Angeles. The dataset we will work
with in Problems 4-7 includes the 104 neighborhoods that, as of 2008, had at least one public school in
the neighborhood. Here is some important information about the variables in the dataset:
. Neighborhood: the name of the neighborhood
* Income: the median income of the neighborhood's residents, in thousands of dollars
. Schools: the median API score of schools in the neighborhood, measured on a scale from 2000
(bad) to 1000 (good)
Asian corresponds to Asian 5)
measured on a scale from 1 (not diverse at all) to 10 (very diverse)
· Asian, Black, Latino, white: the percentage of residents with each of those ethnicities (i.e.,5%
. Diversity: how likely neighborhood residents are to encounter a resident of a different ethnicity,
. Population: the neighborhood's population, according to the 2000 U.S. Census, in thousands
How many cases are in this dataset?
Which variable is the label variable?
categorica iable (circle one)?
Is population a
quantitative
Was this dataset collected from an
observational study
(circle one)?
experiment
Which of the following plots would be useful for identifying the distribution of Income:
(circle one)?
histogram
scatter plot
pie chart
Expert Solution
This question has been solved!
Explore an expertly crafted, step-by-step solution for a thorough understanding of key concepts.

This is a popular solution!

Trending now
This is a popular solution!

Step by step
Solved in 6 steps

Recommended textbooks for you
MATLAB: An Introduction with Applications
Statistics
ISBN:
9781119256830
Author:
Amos Gilat
Publisher:
John Wiley & Sons Inc

Probability and Statistics for Engineering and th…
Statistics
ISBN:
9781305251809
Author:
Jay L. Devore
Publisher:
Cengage Learning

Statistics for The Behavioral Sciences (MindTap C…
Statistics
ISBN:
9781305504912
Author:
Frederick J Gravetter, Larry B. Wallnau
Publisher:
Cengage Learning
MATLAB: An Introduction with Applications
Statistics
ISBN:
9781119256830
Author:
Amos Gilat
Publisher:
John Wiley & Sons Inc
Probability and Statistics for Engineering and th…
Statistics
ISBN:
9781305251809
Author:
Jay L. Devore
Publisher:
Cengage Learning
Statistics for The Behavioral Sciences (MindTap C…
Statistics
ISBN:
9781305504912
Author:
Frederick J Gravetter, Larry B. Wallnau
Publisher:
Cengage Learning

Elementary Statistics: Picturing the World (7th E…
Statistics
ISBN:
9780134683416
Author:
Ron Larson, Betsy Farber
Publisher:
PEARSON

The Basic Practice of Statistics
Statistics
ISBN:
9781319042578
Author:
David S. Moore, William I. Notz, Michael A. Fligner
Publisher:
W. H. Freeman

Introduction to the Practice of Statistics
Statistics
ISBN:
9781319013387
Author:
David S. Moore, George P. McCabe, Bruce A. Craig
Publisher:
W. H. Freeman