in the residuals when plotted against x? Year x (year minus 1975) | y (percent assets) 1975 30.2 1976 1 28.4 1977 28.3 1978 26.7 1979 1980 26.8 25.3 1981 6 23.4 1982 7 22.6 1983 22.3 1984 22.2 1985 1986 10 21.4 11 21.5 1987 12 22.5
in the residuals when plotted against x? Year x (year minus 1975) | y (percent assets) 1975 30.2 1976 1 28.4 1977 28.3 1978 26.7 1979 1980 26.8 25.3 1981 6 23.4 1982 7 22.6 1983 22.3 1984 22.2 1985 1986 10 21.4 11 21.5 1987 12 22.5

Functions and Change: A Modeling Approach to College Algebra (MindTap Course List)
6th Edition
ISBN:9781337111348
Author:Bruce Crauder, Benny Evans, Alan Noell
Publisher:Bruce Crauder, Benny Evans, Alan Noell
Chapter3: Straight Lines And Linear Functions
Section3.CR: Chapter Review Exercises
Problem 15CR: Life Expectancy The following table shows the average life expectancy, in years, of a child born in...

Related questions

Concept explainers
Equations and Inequations
Equations and inequalities describe the relationship between two mathematical expressions.
Linear Functions
A linear function can just be a constant, or it can be the constant multiplied with the variable like x or y. If the variables are of the form, x2, x1/2 or y2 it is not linear. The exponent over the variables should always be 1.
Question
i need Part 10,11 and 12 Solution.
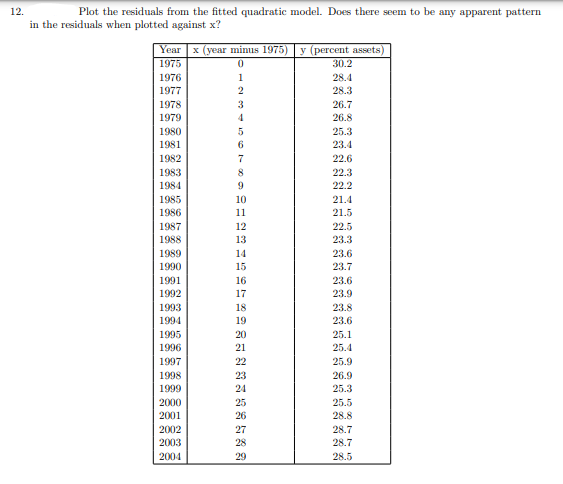
Transcribed Image Text:12.
Plot the residuals from the fitted quadratic model. Does there seem to be any apparent pattern
in the residuals when plotted against x?
Year x (year minus 1975) y (percent assets)
1975
30.2
1976
1
28.4
1977
2
28.3
1978
3
26.7
1979
26.8
1980
25.3
1981
6
23.4
1982
22.6
1983
22.3
1984
9.
22.2
1985
10
21.4
1986
11
21.5
1987
1988
12
22.5
13
23.3
1989
14
23.6
1990
15
23.7
1991
16
23.6
1992
17
23.9
1993
18
23.8
1994
19
23.6
1995
20
25.1
1996
21
25.4
1997
22
25.9
1998
23
26.9
1999
24
25.3
2000
25
25.5
2001
26
28.8
2002
27
28.7
2003
28
28.7
2004
29
28.5

Transcribed Image Text:Exercise 3. Are Foreign Companies "Buying Up the Canadian Economy"?
for sale! We're losing our sovereignty! Dire statements such as these frequently appear in the media when news
breaks about a well-known Canadian company being purchased by a foreign competitor, with the implication that
there will soon be no Canadian-owned companies left. In the following case study, we explore the relationship
between the percentage of foreign ownership and year, using a simple linear regression analysis. One response
has been for the Canadian government to try to regulate takeovers, making it more difficult for foreign companies
to directly invest in Canada. At other times, the government has sought to encourage foreign investment by
changing or rescinding regulations. For example, the Foreign Investment Review Agency was created in 1975 to
monitor and regulate foreign takeovers in Canada. In 1985, after a change of government, the Foreign Investment.
Review Agency was replaced with a new agency, Investment Canada, whose mandate was intended to be less
restrictive. Have these changes had any effect? The data in the table represent the percentage of commercial
assets in non-financial corporations under foreign control y for the years 1975 to 2004. To simplify the analysis,
we have coded the year using the coded variable r = year – 1975.
Canada's
1.
Using a scatterplot with Minitab, plot the data for the years 1975-1985. Does there appear to be
a linear relationship between the percentage of foreign ownership and the year?
2.
Use Minitab to find the least-squares line for predicting the percentage of foreign ownership as a
function of year for the years 1975-1985.
3.
Is there a significant linear relationship between the percentage of foreign ownership and year at
the level of significance of 5%? (Use the Minitab output from the previous question).
4.
Use Minitab to predict the percentage of foreign ownership with 95% prediction intervals for the
years 2002, 2003, and 2004.
5.
Now look at the actual data points for those years. Do the predictions obtained in step 4 provide
accurate estimates of the actual values observed in these years? Explain.
6.
Using Minitab, construct the plot of residuals against the z values and then against the predicted
y values. What can you conclude about the validity of the constant variance assumption?
7.
Using Minitab, plot the histogram of the residuals e; and the normal probability plot of residuals.
What can you conclude about the normality assumption?
8.
Add the data for 1986-2004 to your database, and recaleulate the regression line using again
Minitab. What effect have the new data points had on the slope? What is the effect on SSE?
9.
Plot using Minitab the scatterplot of residuals against r, does it appear that a straight line provides
an accurate model for the data? What model do the residuals indicate would produce a better fit?
10.
Plot using Minitab the data with a quadratic model fitted to them. Sketch what you consider to
be the best-fitting linear or quadratic models?
11.
What is the increase in R when you fit a quadratic rather than a linear model? Is the coefficient
of the quadratic term significant? Is the fitted quadratic model significantly better than the fitted linear
model? (Use a = 0.05).
Expert Solution
This question has been solved!
Explore an expertly crafted, step-by-step solution for a thorough understanding of key concepts.

This is a popular solution!

Trending now
This is a popular solution!

Step by step
Solved in 5 steps with 1 images

Knowledge Booster


Learn more about
Need a deep-dive on the concept behind this application? Look no further. Learn more about this topic, advanced-math and related others by exploring similar questions and additional content below.Recommended textbooks for you
Functions and Change: A Modeling Approach to Coll…
Algebra
ISBN:
9781337111348
Author:
Bruce Crauder, Benny Evans, Alan Noell
Publisher:
Cengage Learning
Functions and Change: A Modeling Approach to Coll…
Algebra
ISBN:
9781337111348
Author:
Bruce Crauder, Benny Evans, Alan Noell
Publisher:
Cengage Learning