In the short run, firms will In the short run, the supply curve will On the previous graph, show the shift in the supply curve and then use the purple point (diamond symbol) to indicate the resulting new long- run equilibrium. Comparing the two long-run equilibria on the graph, you can see that the orange juice market is an example of On the previous graph, use the green line (diamond symbols) to plot the long-run market supply curve for orange juice.
In the short run, firms will In the short run, the supply curve will On the previous graph, show the shift in the supply curve and then use the purple point (diamond symbol) to indicate the resulting new long- run equilibrium. Comparing the two long-run equilibria on the graph, you can see that the orange juice market is an example of On the previous graph, use the green line (diamond symbols) to plot the long-run market supply curve for orange juice.

Microeconomics: Private and Public Choice (MindTap Course List)
16th Edition
ISBN:9781305506893
Author:James D. Gwartney, Richard L. Stroup, Russell S. Sobel, David A. Macpherson
Publisher:James D. Gwartney, Richard L. Stroup, Russell S. Sobel, David A. Macpherson
Chapter9: Price Takers And The Competitive Process
Section: Chapter Questions
Problem 11CQ

Related questions
Question
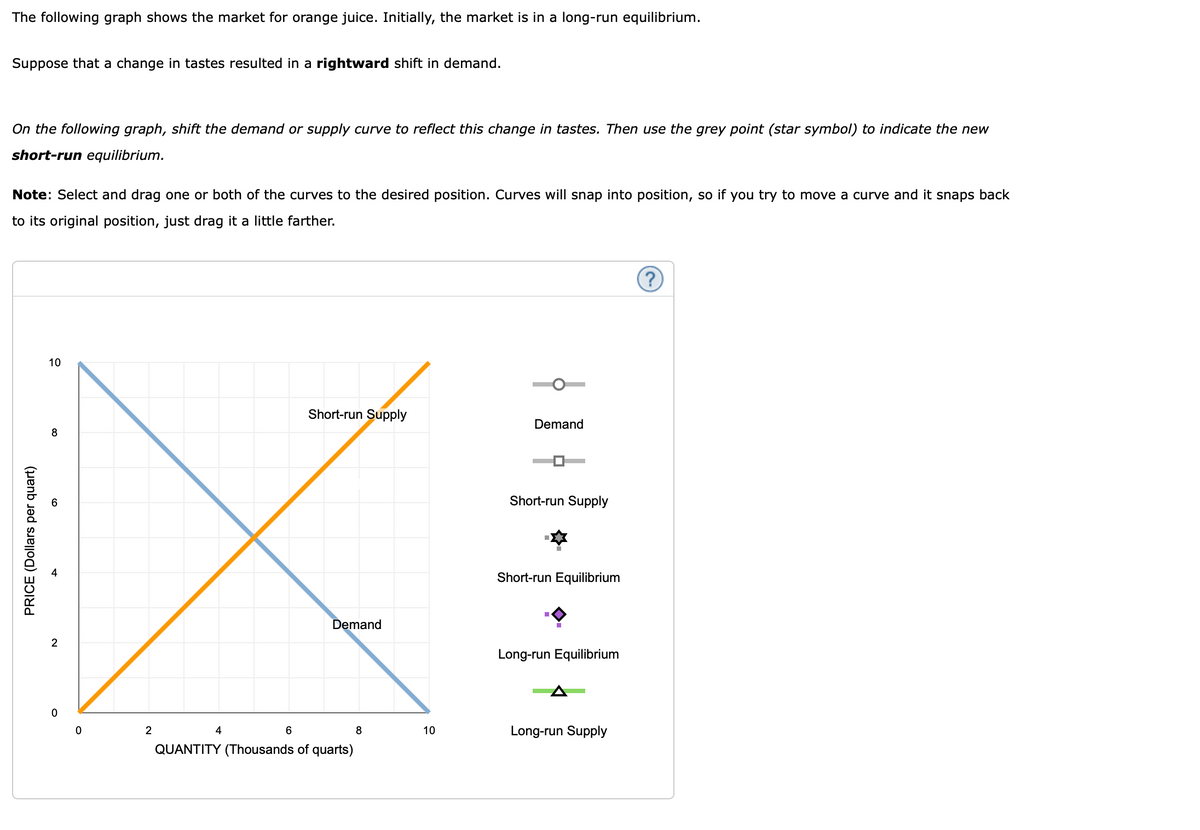
Transcribed Image Text:The following graph shows the market for orange juice. Initially, the market is in a long-run equilibrium.
Suppose that a change in tastes resulted in a rightward shift in demand.
On the following graph, shift the demand or supply curve to reflect this change in tastes. Then use the grey point (star symbol) to indicate the new
short-run equilibrium.
Note: Select and drag one or both of the curves to the desired position. Curves will snap into position, so if you try to move a curve and it snaps back
to its original position, just drag it a little farther.
10
Short-run Supply
Demand
8
Short-run Supply
Short-run Equilibrium
Demand
2
Long-run Equilibrium
2
4
8
10
Long-run Supply
QUANTITY (Thousands of quarts)
PRICE (Dollars per quart)
Transcribed Image Text:In the short run, firms will
. In the short run, the supply curve will
On the previous graph, show the shift in the supply curve and then use the purple point (diamond symbol) to indicate the resulting new long-
run equilibrium.
Comparing the two long-run equilibria on the graph, you can see that the orange juice market is an example of
On the previous graph, use the green line (diamond symbols) to plot the long-run market supply curve for orange juice.
Expert Solution
This question has been solved!
Explore an expertly crafted, step-by-step solution for a thorough understanding of key concepts.

This is a popular solution!

Trending now
This is a popular solution!

Step by step
Solved in 2 steps with 1 images

Knowledge Booster


Learn more about
Need a deep-dive on the concept behind this application? Look no further. Learn more about this topic, economics and related others by exploring similar questions and additional content below.Recommended textbooks for you
Microeconomics: Private and Public Choice (MindTa…
Economics
ISBN:
9781305506893
Author:
James D. Gwartney, Richard L. Stroup, Russell S. Sobel, David A. Macpherson
Publisher:
Cengage Learning

Economics: Private and Public Choice (MindTap Cou…
Economics
ISBN:
9781305506725
Author:
James D. Gwartney, Richard L. Stroup, Russell S. Sobel, David A. Macpherson
Publisher:
Cengage Learning

Microeconomics: Private and Public Choice (MindTa…
Economics
ISBN:
9781305506893
Author:
James D. Gwartney, Richard L. Stroup, Russell S. Sobel, David A. Macpherson
Publisher:
Cengage Learning
Economics: Private and Public Choice (MindTap Cou…
Economics
ISBN:
9781305506725
Author:
James D. Gwartney, Richard L. Stroup, Russell S. Sobel, David A. Macpherson
Publisher:
Cengage Learning


Economics (MindTap Course List)
Economics
ISBN:
9781337617383
Author:
Roger A. Arnold
Publisher:
Cengage Learning