is selected at random. Find the probability the is female or Republican. What rule will you use? P(female) A representative representative a. Which keyword do you see? b. How many representatives are female? (fraction) c. How many representatives are P(Republican) = d. From 3d, P(female and Republican) = (fraction) e. Add your answers from (b) and (c) and then subtract your answer from (d). The probability the representative is female or Republican is (fraction)~ (3 decimal places). Republican? (fraction)
is selected at random. Find the probability the is female or Republican. What rule will you use? P(female) A representative representative a. Which keyword do you see? b. How many representatives are female? (fraction) c. How many representatives are P(Republican) = d. From 3d, P(female and Republican) = (fraction) e. Add your answers from (b) and (c) and then subtract your answer from (d). The probability the representative is female or Republican is (fraction)~ (3 decimal places). Republican? (fraction)

MATLAB: An Introduction with Applications
6th Edition
ISBN:9781119256830
Author:Amos Gilat
Publisher:Amos Gilat
Chapter1: Starting With Matlab
Section: Chapter Questions
Problem 1P

Related questions
Question
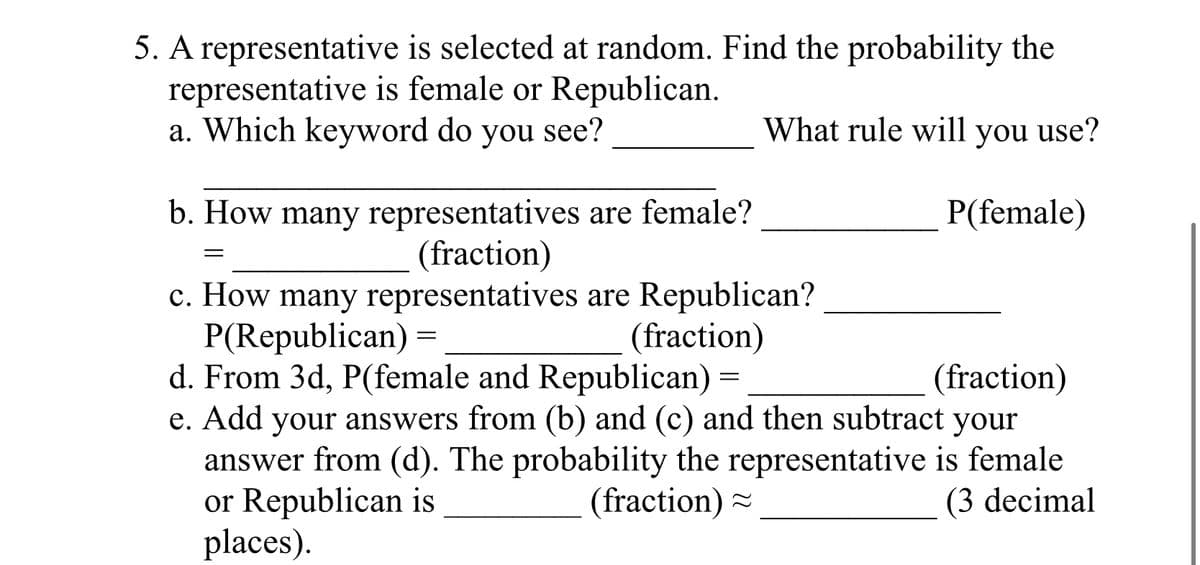
Transcribed Image Text:5. A representative is selected at random. Find the probability the
representative is female or Republican.
a. Which keyword do you see?
What rule will you use?
P(female)
b. How many representatives are female?
(fraction)
=
c. How many representatives are Republican?
P(Republican) =
(fraction)
d. From 3d, P(female and Republican) =
(fraction)
e. Add your answers from (b) and (c) and then subtract your
answer from (d). The probability the representative is female
or Republican is
(fraction)
(3 decimal
places).

Transcribed Image Text:As of January 3, 2019, the US House of Representatives had the
following demographics:
U.S. House of Representatives
Gender
Male
Female
Total
Political Party
Republican Democrat Total
327
106
433
183
15
198
144
91
235
Expert Solution
This question has been solved!
Explore an expertly crafted, step-by-step solution for a thorough understanding of key concepts.

This is a popular solution!

Trending now
This is a popular solution!

Step by step
Solved in 6 steps

Recommended textbooks for you
MATLAB: An Introduction with Applications
Statistics
ISBN:
9781119256830
Author:
Amos Gilat
Publisher:
John Wiley & Sons Inc

Probability and Statistics for Engineering and th…
Statistics
ISBN:
9781305251809
Author:
Jay L. Devore
Publisher:
Cengage Learning

Statistics for The Behavioral Sciences (MindTap C…
Statistics
ISBN:
9781305504912
Author:
Frederick J Gravetter, Larry B. Wallnau
Publisher:
Cengage Learning
MATLAB: An Introduction with Applications
Statistics
ISBN:
9781119256830
Author:
Amos Gilat
Publisher:
John Wiley & Sons Inc
Probability and Statistics for Engineering and th…
Statistics
ISBN:
9781305251809
Author:
Jay L. Devore
Publisher:
Cengage Learning
Statistics for The Behavioral Sciences (MindTap C…
Statistics
ISBN:
9781305504912
Author:
Frederick J Gravetter, Larry B. Wallnau
Publisher:
Cengage Learning

Elementary Statistics: Picturing the World (7th E…
Statistics
ISBN:
9780134683416
Author:
Ron Larson, Betsy Farber
Publisher:
PEARSON

The Basic Practice of Statistics
Statistics
ISBN:
9781319042578
Author:
David S. Moore, William I. Notz, Michael A. Fligner
Publisher:
W. H. Freeman

Introduction to the Practice of Statistics
Statistics
ISBN:
9781319013387
Author:
David S. Moore, George P. McCabe, Bruce A. Craig
Publisher:
W. H. Freeman