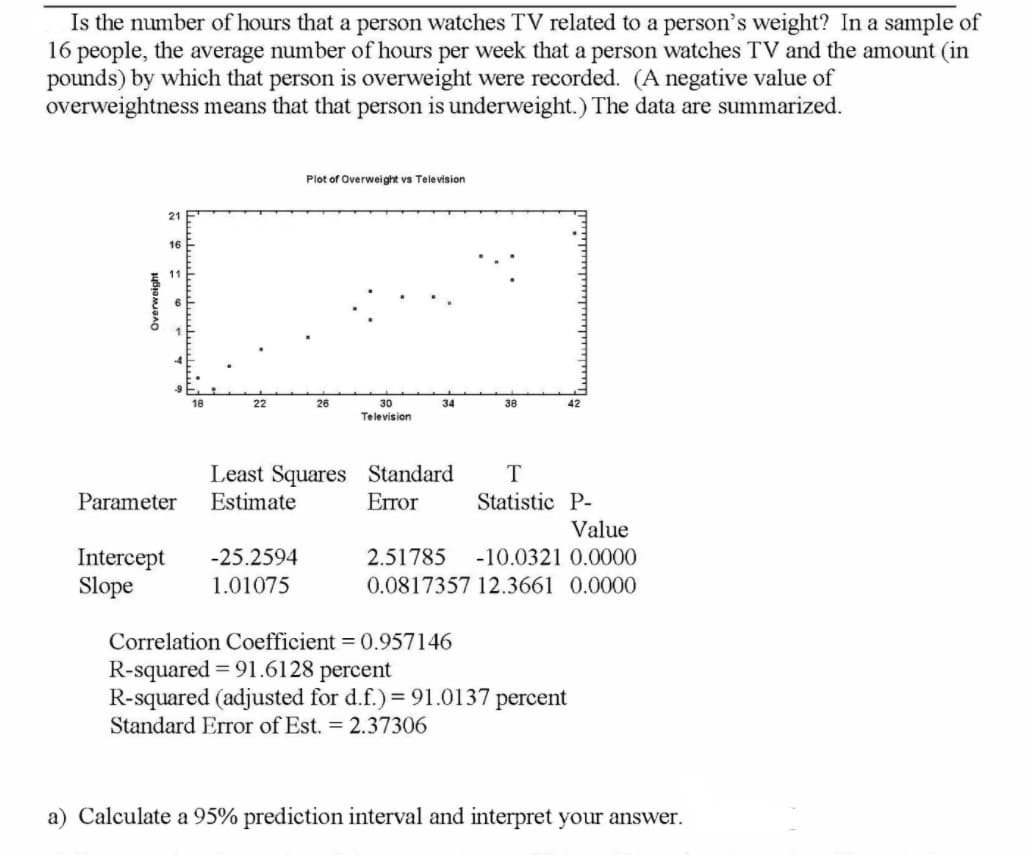
Is the number of hours that a person watches TV related to a person's weight? In a sample of 16 people, the average number of hours per week that a person watches TV and the amount (in pounds) by which that person is overweight were recorded. (A negative value of overweightness means that that person is underweight.) The data are summarized. Plot of Overweight vs Television 18 22 26 30 Television 34 38 Least Squares Standard Estimate T Parameter Error Statistic P- Value Intercept Slope -25.2594 2.51785 -10.0321 0.0000 1.01075 0.0817357 12.3661 0.0000 Correlation Coefficient = 0.957146 R-squared = 91.6128 percent R-squared (adjusted for d.f.)= 91.0137 percent Standard Error of Est. = 2.37306 a) Calculate a 95% prediction interval and interpret your answer. Overweight


Percentage
A percentage is a number indicated as a fraction of 100. It is a dimensionless number often expressed using the symbol %.
Algebraic Expressions
In mathematics, an algebraic expression consists of constant(s), variable(s), and mathematical operators. It is made up of terms.
Numbers
Numbers are some measures used for counting. They can be compared one with another to know its position in the number line and determine which one is greater or lesser than the other.
Subtraction
Before we begin to understand the subtraction of algebraic expressions, we need to list out a few things that form the basis of algebra.
Addition
Before we begin to understand the addition of algebraic expressions, we need to list out a few things that form the basis of algebra.
Dear tutor kindly help me

Step by step
Solved in 2 steps with 2 images


