Listed below are amounts of court income and salaries paid to the town justices. All amounts are in thousands of dollars. Construct a scatterplot, find the value of the linear correlation coefficient r, and find th P-value using a = 0.05. Is there sufficient evidence to conclude that there is a linear correlation between court incomes and justice salaries? Based on the results, does it appear that justices might profit by levying larger fines? Court Income Justice Salary 66.0 402.0 1568 01130.0 274.0 252.0 112.0 150 0 34.0 O 44 60 29 42 94 58 26 27 17 ... H, p<0 H pt0 OC. Ho p 0 H p=0 O D. Ho p=0 H, p>0 Construct a scatterplot. Choose the correct graph below. D. OA. O A. O B. OC. AJustice Salary 100- AJustice Salary 100 AJustice Salary 100 AJustice Salary 100 - Q. - --- 50 50 50 50- 0+ 0- 04 1600 800 Court Income 0- 800 1600 800 1600 300 1600 Court income Court Income Court Income The linear correlation coefficient is r= (Round to three decimal places as needed.) rar The test statistic is t=| (Round to three decimal places as needed.) ns The P-value is (Round to three decimal places as needed.) V than the significance level 0.05, there V sufficient evidence to support the claim that there is a' linear correlation between court incomes and justice salaries for a Because the P-value is significance level of a = 0 05. Based on the results, does it appear that justices might profit by levying larger fines? O A. It does not appear that justices might profit by levying larger fines. O B. It does appear that justices might profit by issuing smaller fines. O C. It appears that justices profit the same despite the amount of the fines O D. It does appear that justices might profit by levying larger fines
Listed below are amounts of court income and salaries paid to the town justices. All amounts are in thousands of dollars. Construct a scatterplot, find the value of the linear correlation coefficient r, and find th P-value using a = 0.05. Is there sufficient evidence to conclude that there is a linear correlation between court incomes and justice salaries? Based on the results, does it appear that justices might profit by levying larger fines? Court Income Justice Salary 66.0 402.0 1568 01130.0 274.0 252.0 112.0 150 0 34.0 O 44 60 29 42 94 58 26 27 17 ... H, p<0 H pt0 OC. Ho p 0 H p=0 O D. Ho p=0 H, p>0 Construct a scatterplot. Choose the correct graph below. D. OA. O A. O B. OC. AJustice Salary 100- AJustice Salary 100 AJustice Salary 100 AJustice Salary 100 - Q. - --- 50 50 50 50- 0+ 0- 04 1600 800 Court Income 0- 800 1600 800 1600 300 1600 Court income Court Income Court Income The linear correlation coefficient is r= (Round to three decimal places as needed.) rar The test statistic is t=| (Round to three decimal places as needed.) ns The P-value is (Round to three decimal places as needed.) V than the significance level 0.05, there V sufficient evidence to support the claim that there is a' linear correlation between court incomes and justice salaries for a Because the P-value is significance level of a = 0 05. Based on the results, does it appear that justices might profit by levying larger fines? O A. It does not appear that justices might profit by levying larger fines. O B. It does appear that justices might profit by issuing smaller fines. O C. It appears that justices profit the same despite the amount of the fines O D. It does appear that justices might profit by levying larger fines

Big Ideas Math A Bridge To Success Algebra 1: Student Edition 2015
1st Edition
ISBN:9781680331141
Author:HOUGHTON MIFFLIN HARCOURT
Publisher:HOUGHTON MIFFLIN HARCOURT
Chapter4: Writing Linear Equations
Section: Chapter Questions
Problem 11CT

Related questions
Question
2
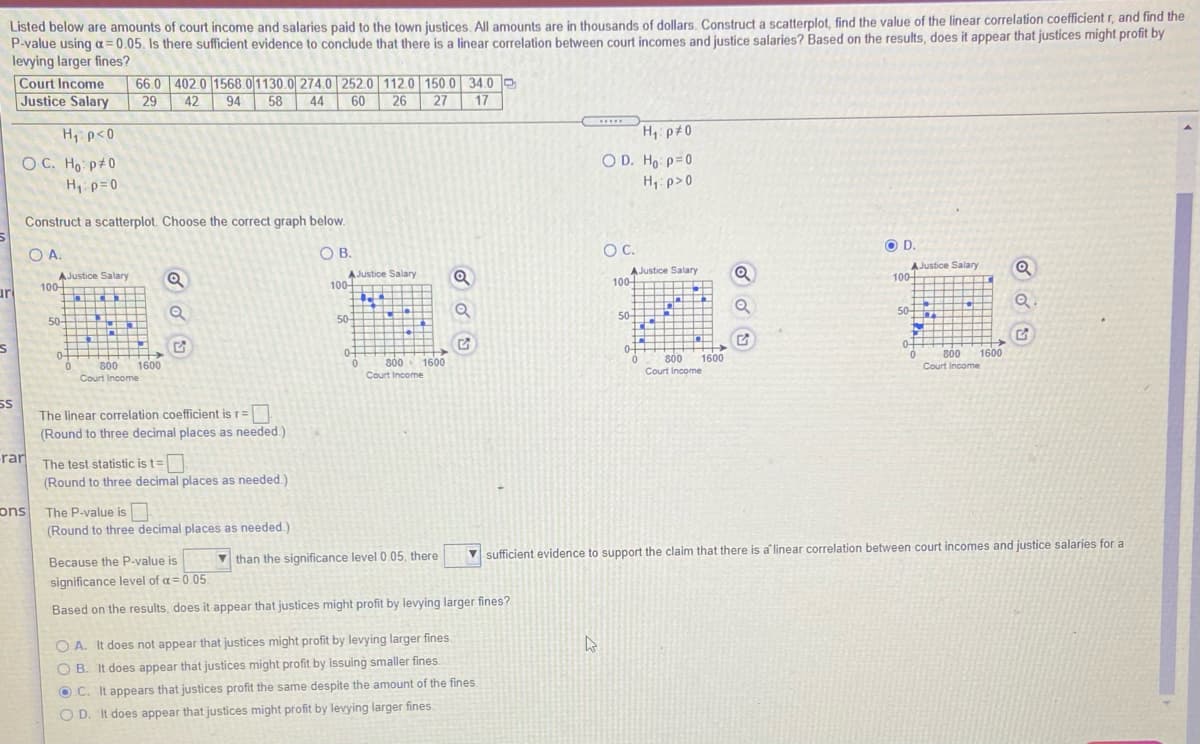
Transcribed Image Text:Listed below are amounts of court income and salaries paid to the town justices. All amounts are in thousands of dollars Construct a scatterplot, find the value of the linear correlation coefficient r, and find the
P-value using a = 0.05. Is there sufficient evidence to conclude that there is a linear correlation between court incomes and justice salaries? Based on the results, does it appear that justices might profit by
levying larger fines?
Court Income
Justice Salary
66.0 402.0 1568.0|1130.0 274.0| 252.0 112.0 150.0 34.0 0
44
60
29
42
94
58
26
27 17
....
H p<0
H p#0
OC. Ho p#0
H p=0
O D. Ho: p=0
H,:p>0
Construct a scatterplot. Choose the correct graph below.
OA.
O A.
OB.
OC.
OD.
AJustice Salary
AJustice Salary
100
AJustice Salary
100-
AJustice Salary
100-
ur
100
-
.----
Q.
50-
50+ +++-
50-
50-
50+
1 NEE
--- ----
0-
0-
04
0-
800
1600
+ HII
800
Court Income
1600
800 1600
Court Income
800
Court Income
1600
Court Income
The linear corelation coefficient is r=
(Round to three decimal places as needed.)
rar
The test statistic is t=
(Round to three decimal places as needed.)
ons The P-value is
(Round to three decimal places as needed.)
V than the significance level 0.05, there
V sufficient evidence to support the claim that there is a' linear correlation between court incomes and justice salaries for a
Because the P-value is
significance level of a= 0 05
Based on the results, does it appear that justices might profit by levying larger fines?
O A. It does not appear that justices might profit by levying larger fines.
O B. It does appear that justices might profit by issuing smaller fines.
O C. It appears that justices profit the same despite the amount of the fines.
O D. It does appear that justices might profit by levying larger fines.
Expert Solution
This question has been solved!
Explore an expertly crafted, step-by-step solution for a thorough understanding of key concepts.

This is a popular solution!

Trending now
This is a popular solution!

Step by step
Solved in 3 steps with 6 images

Recommended textbooks for you
Big Ideas Math A Bridge To Success Algebra 1: Stu…
Algebra
ISBN:
9781680331141
Author:
HOUGHTON MIFFLIN HARCOURT
Publisher:
Houghton Mifflin Harcourt

Glencoe Algebra 1, Student Edition, 9780079039897…
Algebra
ISBN:
9780079039897
Author:
Carter
Publisher:
McGraw Hill
Big Ideas Math A Bridge To Success Algebra 1: Stu…
Algebra
ISBN:
9781680331141
Author:
HOUGHTON MIFFLIN HARCOURT
Publisher:
Houghton Mifflin Harcourt
Glencoe Algebra 1, Student Edition, 9780079039897…
Algebra
ISBN:
9780079039897
Author:
Carter
Publisher:
McGraw Hill