Listed below are amounts of strontium-90 (in millibecquerels, or mBq) in a simple random sample of baby teeth obtained from residents in a region bom after 1979. Use the given data to construct a boxplot and identify the 5-number summary 127 129 131 135 138 142 145 146 148 151 O 153 154 156 157 158 161 162 162 165 172 The 5-number summary isD0.00.and all in mBq. (Use ascending order. Type integers or decimals. Do not round) Which boxplot below represents the data? OA. OB. 200 C 100 120 140 160 180 20o C Strontium0 (mBa) 140 160 Strontum0 (mBa) 120 180 OC. OD. . 120 140 160 Strontium-00 (ma) 100 180 120 140 160 180 200 C Strontium-0 -a)
Listed below are amounts of strontium-90 (in millibecquerels, or mBq) in a simple random sample of baby teeth obtained from residents in a region bom after 1979. Use the given data to construct a boxplot and identify the 5-number summary 127 129 131 135 138 142 145 146 148 151 O 153 154 156 157 158 161 162 162 165 172 The 5-number summary isD0.00.and all in mBq. (Use ascending order. Type integers or decimals. Do not round) Which boxplot below represents the data? OA. OB. 200 C 100 120 140 160 180 20o C Strontium0 (mBa) 140 160 Strontum0 (mBa) 120 180 OC. OD. . 120 140 160 Strontium-00 (ma) 100 180 120 140 160 180 200 C Strontium-0 -a)

Glencoe Algebra 1, Student Edition, 9780079039897, 0079039898, 2018
18th Edition
ISBN:9780079039897
Author:Carter
Publisher:Carter
Chapter10: Statistics
Section10.1: Measures Of Center
Problem 9PPS

Related questions
Question
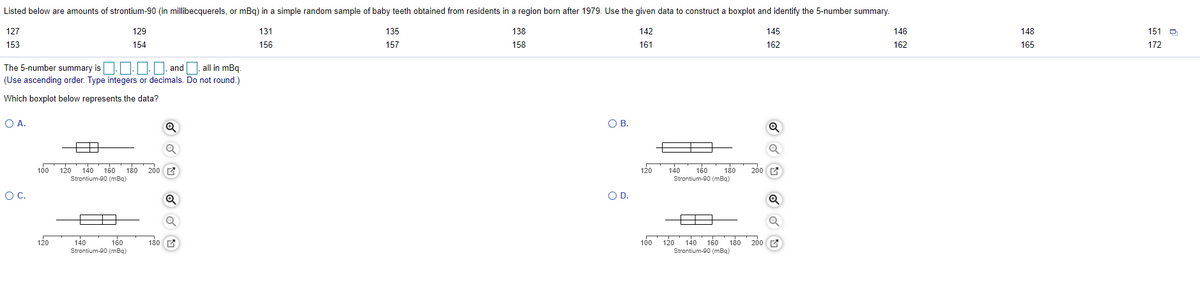
Transcribed Image Text:Listed below are amounts of strontium-90 (in millibecquerels, or mBg) in a simple random sample of baby teeth obtained from residents in a region born after 1979. Use the given data to construct a boxplot and identify the 5-number summary.
127
129
131
135
138
142
145
146
148
151 D
153
154
156
157
158
161
162
162
165
172
The 5-number summary is | | and all in mBq.
(Use ascending order. Type integers or decimals. Do not round.)
Which boxplot below represents the data?
O A.
O B.
100
120 140
160
180 200
140
160
180
200 A
120
Strontium-00 (mBq)
Strontium-00 (mBg)
OC.
OD.
120
140
160
180 C
100
120 140 16o 180 200
Strontium-90 (mBq)
Strontium-90 (mBq)
Expert Solution
This question has been solved!
Explore an expertly crafted, step-by-step solution for a thorough understanding of key concepts.

This is a popular solution!

Trending now
This is a popular solution!

Step by step
Solved in 3 steps with 1 images

Knowledge Booster


Learn more about
Need a deep-dive on the concept behind this application? Look no further. Learn more about this topic, statistics and related others by exploring similar questions and additional content below.Recommended textbooks for you
Glencoe Algebra 1, Student Edition, 9780079039897…
Algebra
ISBN:
9780079039897
Author:
Carter
Publisher:
McGraw Hill
Glencoe Algebra 1, Student Edition, 9780079039897…
Algebra
ISBN:
9780079039897
Author:
Carter
Publisher:
McGraw Hill