Loan applications received Interest rate (%) Loan applications 18 6.5 22 5.5 30 6. 24 8 16 8.5 18 6 28 6.5 27 7.5 20 8 17 21


Q: Shelf Space (feet) Weekly Sales (Thousands) 5 16 5 22 8 14 8 19 10 24 10 26 14 23 14 27 19 28 19 26…
A: By secular trend we mean smooth secular trend observes over a long period of time. Smooth increasing…
Q: 3.29 The quarterly revenues of a small medical supply company for the last several years (27…
A: Note: As per the guidelines, we are solving first three subparts for you. Please repost the complete…
Q: The figure below shows the relationship between the price of a cellphone (in 100 TL) and the sales…
A: Given :
Q: ADVA Preferred Music Genre Rap Rock Classical 13-20 (Teens) 73% 23% 4% 21-30 (Young Adults) 58% 35%…
A: Given: The provided data of the age groupings and the percentage of group members who prefer rock…
Q: To determine how the number of housing starts is affected by mortgage rates an economist recorded…
A: Correlation coefficient measures the strength and direction of the linear relationship between two…
Q: using the data from the images, compare and analyze the trends shown on the graphs and relate them…
A: Given information: Histogram for the variables bright weight and gestational period.
Q: A property analyst is examining the relationship between the City Council’s valuation on residential…
A: The analyst examines the relationship between the City Council’s valuation on residential property…
Q: . The Food and Drug Administration (FDA) reported the number of new drugs approved over an…
A: A quantitative variable is used to represent amount or quantity, its values are in some numbers,…
Q: Community Federal Bank in Dothan, Alabama, recently increased its fees to customers who use…
A: The given table shows the number of automatic teller transactions by week.
Q: Sales for last 10 weeks are shown in the table below. Plot the data and visually check to see…
A: Given data is :
Q: Favors Distribution Company purchases small imported trinkets in bulk, packages them, and sells the…
A: Linear trend y = a+bx a = intercept b = slope x = time period y = forecast for demand for period x
Q: (a) What is the equation of the linear model? (b) What is the correlation coefficient? (c) Predict…
A:
Q: At one hospital there is some concern about the high turnover rate of nurses. A survey was done to…
A: Obtain the five number summary. The five number summary is obtained below: Boxplot: The box plot…
Q: Find the trend line equation and obtain the trend values for the followin data using the method of…
A:
Q: The table shows the number y of Wal-Mart stores for each year x from 2008 through 2014.Sketch a…
A: The table shows the number y of Wal-Mart stores for each year x from 2008 through 2014
Q: Enter the slope and y-intercept as decimals. The scatter plot with trend line below shows the data…
A: topic: slope and y intercept of a graph
Q: Lily plots out a graph which shows the number of days her classmates have been absent and their…
A: Introduction :- By observing the scatter plot we have to identify the relationship between the two…
Q: Dehoratius Electronics Inc. wants to understand what will be the demand for their product Ezer for…
A: Compute the regression equation: Simple linear regression model: A simple linear regression model is…
Q: 5. The scatter plot below suggests a linear relationship between time spent studying and the grade…
A:
Q: Perform a Trend and Seasonal analysis with the following data. Include the trend formula and the…
A: Hello. Since you have asked multiple questions, we will solve the first question for you. If you…
Q: Using the scatter plot of the registered nurse salary data shown, what type of correlation, if any…
A: The scatterplot of the registered nurse salary data is given.
Q: If the correlation coefficient is –1, which answer is correct? Group of answer choices The slope of…
A: It is given that Correlation coefficient = -1
Q: Table Unemployment rate versus Inflation rate 2007 2008 2009 2010 2011 2012 2013 2014 2015 2016 2017…
A: Scatter plot is
Q: Pursuing an MBA is a major personal investment. Tuition and expenses associated with business school…
A: Least-Square Regression Line: The plot shows the linear relationship between the regressor Y and…
Q: Amex PLC has gathered following information on the sales of face mask from April 2020 to September…
A:
Q: The below data represent the advertising expenditure and sales of Little Liu Ltd from year 2008 to…
A: The below data represent the advertising expenditure and sales of Little Liu Ltd from year 2008 to…
Q: 2. The table below shows the prevalence of smoking among U.S. adults. a. Make a scatter plot for the…
A: a) The scatter plot is Male: 51.2, 42.8, 34.8, 32.2, 28.0, 28.1, 27.6, 26.5, 27.1, 25.9, 25.2,25.2,…
Q: Using the accompanying student grades data, construct a scatter chart for midterm versus final exam…
A: Given data, Midterm Final exam 76 64 84 91 78 68 87 85 75 62 66 78 76 72 94 94…
Q: Perdisco Limited has shared their annual sales revenue over the last 6 financial years from 2010 to…
A: linear trend equation forecast , we will use linear regression model The following data for the X…
Q: Use the Women's Earnings scatterplot below to answer the questions. Women's Earnings as a Percentage…
A: From the scatterplot, the linear regression equation is y^=0.617x-1156.3. Estimate the women’s…
Q: The following data show the quarterly sales of a major auto manufacturer for the years I through 3.…
A: “Since you have posted a question with multiple sub-parts, we will solve first three subparts for…
Q: Fit a trend function y = A. Bx to the following data. 2 3 4 5 y : 1.6 4.5 13.8 40 2 125.0
A:
Q: Amex PLC has gathered following information on the sales of tace mask fPom Api September 2020. Month…
A: Let months following April be denoted by 1, 2, 3 and so on. And
Q: Q3 A manufacturer has plotted product sales over the past four weeks. Use a linear trend line to…
A:
Q: A university would like to examine the linear relationship between a faculty member's performance…
A:
Q: 5. The scatter plot below suggests a linear relationship between time spent studying and the grade…
A: We will solve the following.
Q: Amex PLC has gathered following information on the sales of face mask from April 2020 to September…
A: Linear trend equation forecast method entails finding the linear equation that fits the given data…
Q: Unemployment rate versus Inflation rate 2007 2008 2009 2010 2011 2012 2013 2014 2015 2016 2017…
A: Hello. Since your question has multiple parts, we will solve first question for you. If you want…
Q: Which set of data would probably show a strong positive linear correlation? a) the number of…
A: We have to find set of strong positive linear correlation
Q: particular professor has noticed that the number of people, P, who complain about his attitude is…
A: X=independent variable =P Y=dependent variable=n X Y 1 10 2 10 2 10 3 9 4 6 4 7 5…
Q: Determine if the correlation between the two given variables is likely to be positive or negative,…
A: a) The average selling price of a model of car and the cost of a loaf of bread on a given day are…
Q: A time series plot of the time period (quarterly) verses quarterly sales (in $1,000s) is shown…
A:
Q: squares from the data given below and estimate the sales for 1983: Calculate trend values by the…
A:
Q: Below are given the annual production figures (in thousand tonnes) of a fertiliser factory: Year…
A: Solution :-
Q: 1. Laptop sales for Asus Company over the last 7 weeks are shown in the table below. Plot the data,…
A: Use the Excel And Perform the Regression. Followings are the Steps to perform the Regression 1) Open…
Q: 5. The scatter plot below suggests a linear relationship between time spent studying and the grade…
A: From the graph the line intercepts y-axis At 50%
Q: 53 92 57 84 56 88 55 97 53 87 54 72 57 64 57 91 Is there a strong correlation in this data set? How…
A:
Q: A realtor is displaying the histogram below, which summarizes the percentage appreciation in value…
A: Ogive curve is a type of graph for cumulative values. It provide the median value of the data set.…
Q: A researcher explored the relationship between the percent of snow days during the month of January…
A: The regression line of, Y on X, Y=a+bXwhere, Y depends on X a= intercept of line…
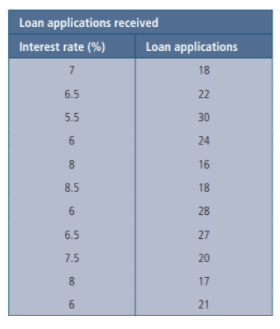
A bank wanted to find out whether the number of loan applications received are influenced by the current loan interest rate. The manager selected 11 monthly periods for which different interest rates applied and recorded the number of loan applications received.
(b) Show the data graphically in a
SHOW SOLUTION PLEASE!


Trending now
This is a popular solution!

Step by step
Solved in 2 steps with 2 images

- 2b) Explain the differences between life insurance and general or non-life insurance.Some trucks purchased by a U-Haul franchise should last 7 years. The purchase price was $176,000. Shipping costs were $5,000. The trade-in (salvage value) is $21,000. Prepare a depreciation schedule by using the double-declining-balance method for the trucks. (Round dollar amounts to the nearest cent. Round your percentages to six decimal places.) chart attachedSalary Increases If you have been hired at an annualsalary of $42,000 and expect to receive annual increasesof 3%, what will your salary be when you begin your fifthyear?
- Universal Suppliers had sales of $473,000 in the month of June. Use the retail method to estimate the value of the inventory (in $) as of June 30 given the following financial information:Calculate the incidence rate of prostate cancer in this population A population of 200 healthy men was followed up for the development of prostate cancer. 10 men were followed-up for 1 year and were then lost to follow-up. After being followed-up for 5 years, 10 men developed prostate cancer. The remaining men who never developed prostate cancer were followed for 10 years.A man holds a note of $6,000 that has an interest rate of 15% annually. The note was made on March 18 and is due November 11. He sells the note to a bank on June 12 at a discount rate of 14% annually. Find the proceeds on the third-party discount note. (Use the banker's rule.)
- Please show me how to do this in Excel. Thank you! Given are the capital shares and existing loan balances of 12 randomly chosen member accounts of a certain cooperative.Shared Capital: 7500, 12800, 9650, 13000, 25000, 15000, 15500, 17250, 18600, 21050, 16750, 17800, 15000, 22100, 10210 Loan Balance : 8788, 9250, 12745, 12334, 15243, 6780, 12740, 15210, 8750, 9936, 15025, 16750, 8898, 16240, 15224a. Find a good estimate of the mean, variance, and standard deviation for the shared capital of the cooperative members.July 11, 2019, Nicholas's mobile home was totally destroyed in a disaster. The area was designated by the President to be a disaster area. On November 15, 2019, Nicholas's insurance company reimbursed him $12,000 for the mobile home. If Nicholas has a gain, when does the replacement period for the mobile home end? 12/31/2021. 12/31/2022. 12/31/2023. 12/31/2024..Strubeck Corporation sponsors a pension plan for its employees. It manages part of the equity portfolio in-house and delegates management of the balance to Super Trust Company. As chief investment officer of Strubeck, you want to review the performance of the in-house and Super Trust portfolios over the last four quarters. You have arranged for outflows and inflows to the portfolios to be made at the very beginning of the quarter. The table below summarizes the inflows and outflows as well as the two portfolios’ valuations. In the table, the ending value is the portfolio’s value just prior to the cash inflow or outflow at the beginning of the quarter. The amount invested is the amount each portfolio manager is responsible for investing.Table 1: Cash Flows for the In-House Strubeck Account and the Super Trust AccountPeriod Quarters 1 2 3…