
MATLAB: An Introduction with Applications
6th Edition
ISBN: 9781119256830
Author: Amos Gilat
Publisher: John Wiley & Sons Inc
expand_more
expand_more
format_list_bulleted
Related questions
Question
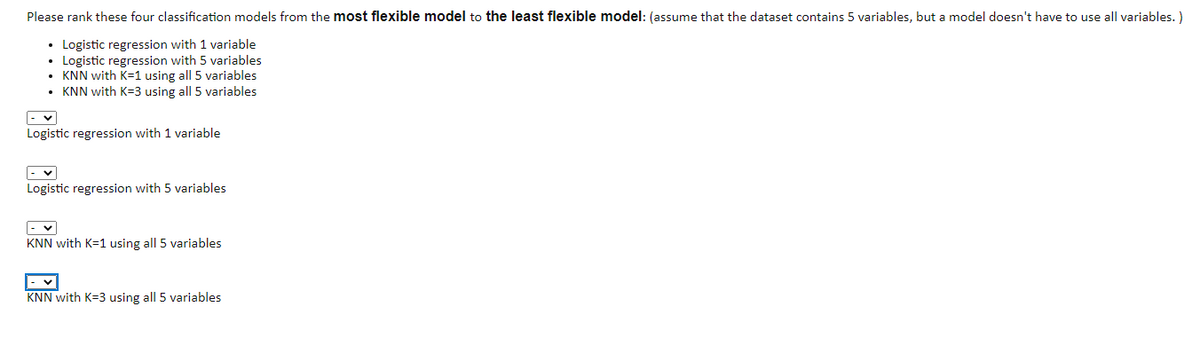

Transcribed Image Text:Please rank these four classification models from the most flexible model to the least flexible model: (assume that the dataset contains 5 variables, but a model doesn't have to use all variables. )
• Logistic regression with 1 variable
• Logistic regression with 5 variables
• KNN with K=1 using all 5 variables
• KNN with K=3 using all 5 variables
Logistic regression with 1 variable
Logistic regression with 5 variables
KNN with K=1 using all 5 variables
KNN with K=3 using all 5 variables
Expert Solution
This question has been solved!
Explore an expertly crafted, step-by-step solution for a thorough understanding of key concepts.

This is a popular solution

Trending nowThis is a popular solution!

Step by stepSolved in 2 steps with 2 images

Knowledge Booster

Similar questions
- If two girl differ in height by 4pm by how much would you expect their FEV1 Predict the FEV1 for a boy who is 1.2 m tall, if the measurement was taken at a pressure of 700 mm and last years measurement was 2.113 L (round to four decimals places)arrow_forwardand test score (y) is V= 67.3+ 1.07x The same data yield r=0.224 and V=75.2. What is the best predicted test 8) Based on the data from six students, the regression equation relating number of hours of preparation (x) Score for a student who spent 2 hours preparing for the test? Use the given data to find the best predicted value of the response variable.arrow_forwardWrite the multiple regression equation for miles per gallon as the response variable. How might the car rental company use this model?arrow_forward
- What is the equation for your model?arrow_forwardWe collected teacher ratings for 25 courses taught by an instructor over a sis-year period. The students ratings of the instructor are on a scale of 1 to 9. We found that The linear regression equation is Anerape Rating 7.88-0.068 Numer of Studenta 1interpret the slope of this model including units The average rating decreases * per each additional student 2. The predicted teacher rating for a class size of 15 students using the givem prediction equation 6.86 6.18 Tiext page CS Scanned with CamScannerarrow_forwardI need the answer as soon as possiblearrow_forward
- compute the least-squares regression line for predicting diatolic pressure (y)from systolic pressure(x) find the P-value Interpret the P-value state a conclusionarrow_forwardWrite Regression equation, identifying all parts. Show all work here. 45 observations were selected. SSxx=87.34 SSxy=193.02 Ex=297.5 Zy=385 xbar = Three decimal places ybar = Three decimal places b1 = Three decimal places bo = Three decimal places regression equation =arrow_forwardQ12. Suppose we are running gradient descent to fit a logistic regression model with 0 E R*+1. Suggest one way to check whether the learning rate « is set properly and that gradient descent is running correctly.arrow_forward
- What do you mean by Generalized method of moments? illustrate regression model with exogenous variables Z?arrow_forwardDue in 3 hours, 41 minutes. Due Sat 04/18/2020 11:59 pm Show Intro/Instructions A regression was run to determine if there is a relationship between hours of study per week (x) and the final exam scores (y). The results of the regression were: у-ах+b a=6.704 b=30.59 p2=0.972196 r=0.986 Use this to predict the final exam score of a student who studies 8.5 hours per week, and please round your answer to a whole number. Hint: Help License Points possible: 1 This is attempt 1 of 3. Message instructor about this question Submitarrow_forwardDefine Least Squares Regression Unbiased Estimators α^, β^, σ^²?arrow_forward
arrow_back_ios
SEE MORE QUESTIONS
arrow_forward_ios
Recommended textbooks for you
- MATLAB: An Introduction with ApplicationsStatisticsISBN:9781119256830Author:Amos GilatPublisher:John Wiley & Sons Inc
 Probability and Statistics for Engineering and th...StatisticsISBN:9781305251809Author:Jay L. DevorePublisher:Cengage Learning
 Statistics for The Behavioral Sciences (MindTap C...StatisticsISBN:9781305504912Author:Frederick J Gravetter, Larry B. WallnauPublisher:Cengage Learning
  Elementary Statistics: Picturing the World (7th E...StatisticsISBN:9780134683416Author:Ron Larson, Betsy FarberPublisher:PEARSON
 The Basic Practice of StatisticsStatisticsISBN:9781319042578Author:David S. Moore, William I. Notz, Michael A. FlignerPublisher:W. H. Freeman
 Introduction to the Practice of StatisticsStatisticsISBN:9781319013387Author:David S. Moore, George P. McCabe, Bruce A. CraigPublisher:W. H. Freeman
MATLAB: An Introduction with Applications
Statistics
ISBN:9781119256830
Author:Amos Gilat
Publisher:John Wiley & Sons Inc
Probability and Statistics for Engineering and th...
Statistics
ISBN:9781305251809
Author:Jay L. Devore
Publisher:Cengage Learning
Statistics for The Behavioral Sciences (MindTap C...
Statistics
ISBN:9781305504912
Author:Frederick J Gravetter, Larry B. Wallnau
Publisher:Cengage Learning
Elementary Statistics: Picturing the World (7th E...
Statistics
ISBN:9780134683416
Author:Ron Larson, Betsy Farber
Publisher:PEARSON
The Basic Practice of Statistics
Statistics
ISBN:9781319042578
Author:David S. Moore, William I. Notz, Michael A. Fligner
Publisher:W. H. Freeman
Introduction to the Practice of Statistics
Statistics
ISBN:9781319013387
Author:David S. Moore, George P. McCabe, Bruce A. Craig
Publisher:W. H. Freeman