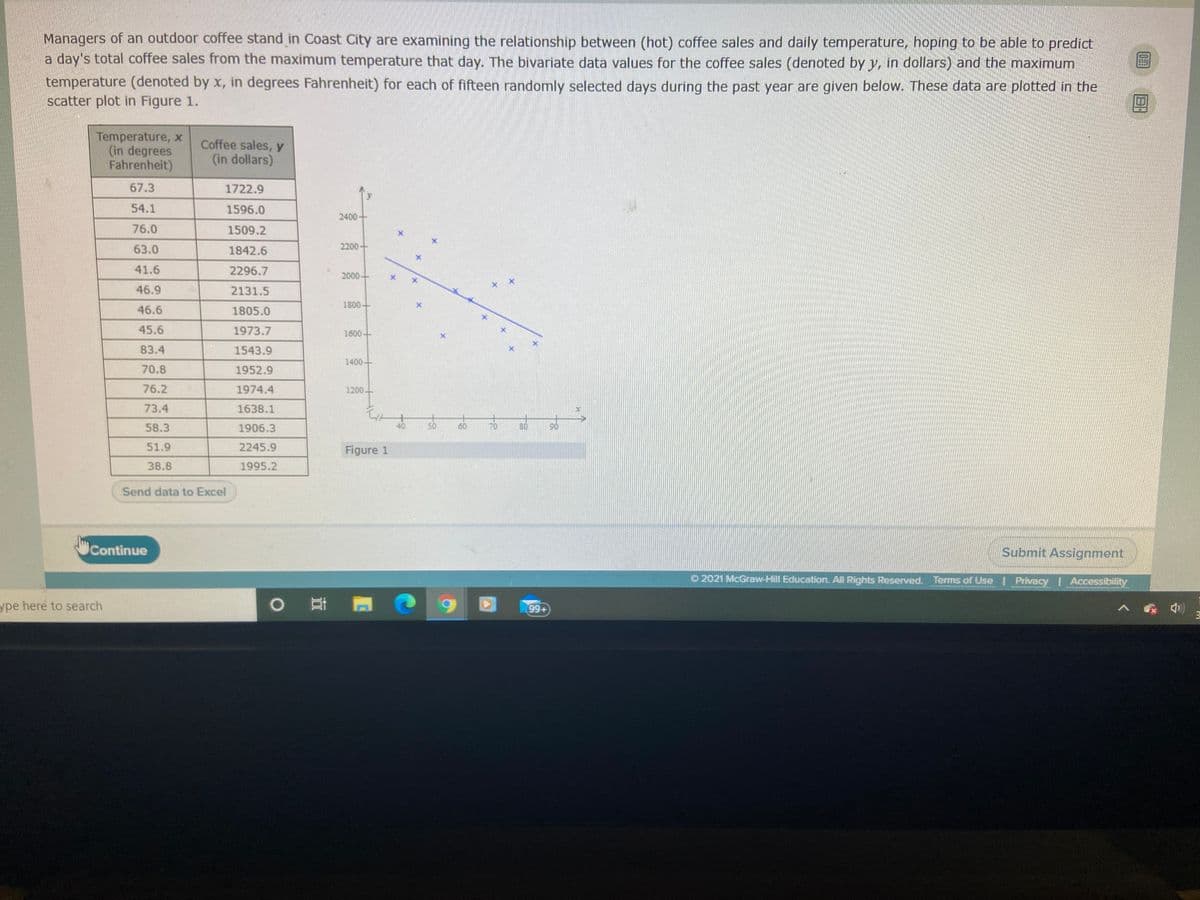
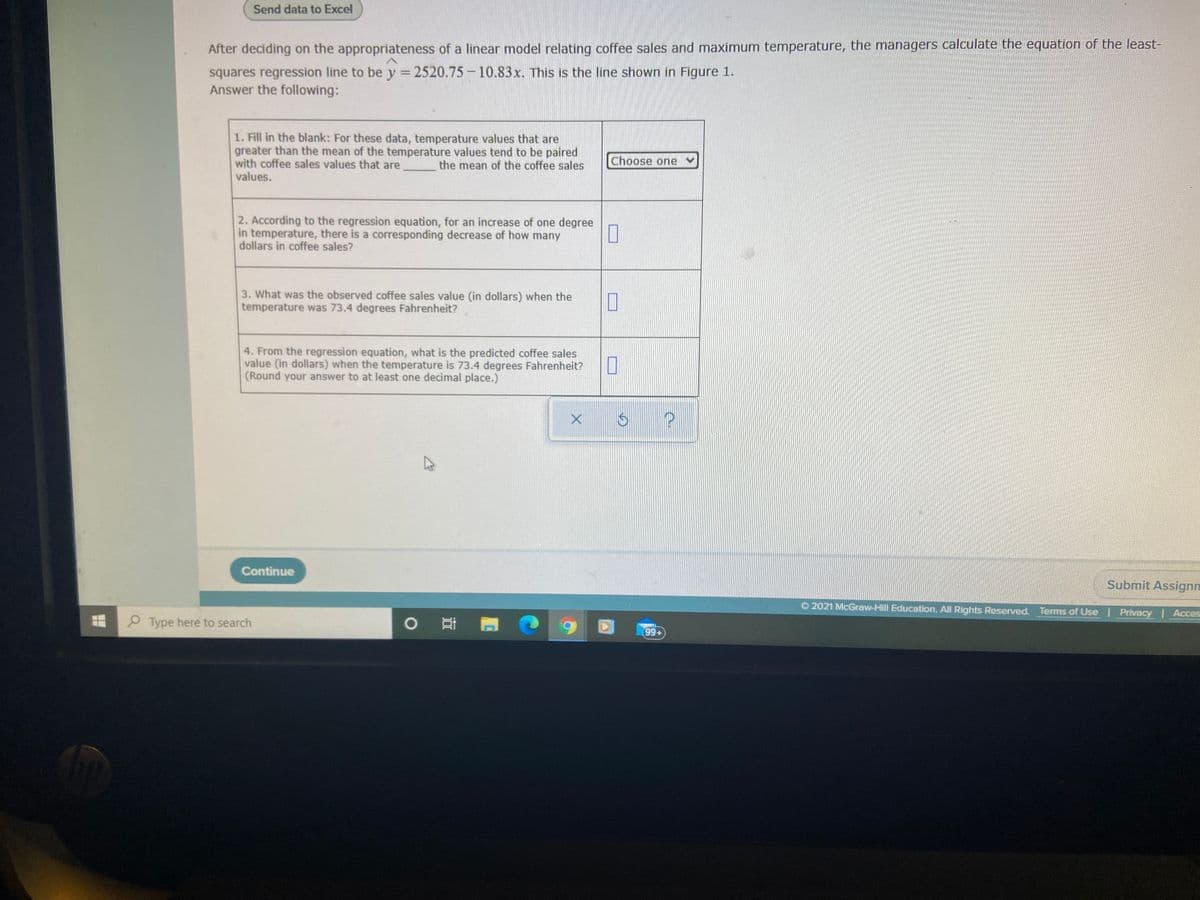
Managers of an outdoor coffee stand in Coast City are examining the relationship between (hot) coffee sales and daily temperature, hoping to be able to predict a day's total coffee sales from the maximum temperature that day. The bivariate data values for the coffee sales (denoted by y, in dollars) and the maximum temperature (denoted by x, in degrees Fahrenheit) for each of fifteen randomly selected days during the past year are given below. These data are plotted in the scatter plot in Figure 1. Temperature, x (in degrees Fahrenheit) Coffee sales, y (in dollars) 67.3 1722.9 54.1 1596.0 2400- 76.0 1509.2 63.0 1842.6 2200 - 41.6 2296.7 2000- 46.9 2131.5 1800- 46.6 1805.0 45.6 1973.7 1600 83.4 1543.9 1400- 70.8 1952.9 76.2 1974.4 1200- 73.4 1638.1 58.3 1906.3 51.9 2245.9 Figure 1 38.8 1995.2 Send data to Excel Continue Submit Assignment O 2021 McGraw-Hill Education. All Rights Reserved. Terms of Use I Privacy Accessibility pe here to search 99+


Correlation
Correlation defines a relationship between two independent variables. It tells the degree to which variables move in relation to each other. When two sets of data are related to each other, there is a correlation between them.
Linear Correlation
A correlation is used to determine the relationships between numerical and categorical variables. In other words, it is an indicator of how things are connected to one another. The correlation analysis is the study of how variables are related.
Regression Analysis
Regression analysis is a statistical method in which it estimates the relationship between a dependent variable and one or more independent variable. In simple terms dependent variable is called as outcome variable and independent variable is called as predictors. Regression analysis is one of the methods to find the trends in data. The independent variable used in Regression analysis is named Predictor variable. It offers data of an associated dependent variable regarding a particular outcome.


Trending now
This is a popular solution!

Step by step
Solved in 2 steps


