Many investors and financial analysts believe the Dow Jones Industrial Average (DJIA) gives a good barometer of the overall stock market. On January 31, 2017, 9 of the 30 stocks making up the DJIA On the basis of this fact, a financial analyst claims we can assume that 62% of the stocks traded on the showed that 55 went up. You are conducting a study to see if the proportion of stocks that went up is significantly smaller than 62%. You use a significance level of a = 0.05. 1. For this study, we should use Select an answer 2. The null and alternative hypotheses would be: Họ: ? v Select an answer H: ? Select an answer (please enter a decimal) (Please enter a decimal) 3. The test statistic - (please show your answer to 3 decimal places.) 4. The p-value - (Please show your answer to 4 decimal places.) 5. The p-value is ? va 6. Based on this, we should Select an answer v the null hypothesis. 7. As such, the final conclusion is that... O The sample data suggest that the populaton proportion is significantly smaller than 62% at a - 0.05, so there is sufficient evidence to conclude that the proportion of stocks that went up is smaller than 62% O The sample data suggest that the population proportion is not significantly smaller than 62% at a - 0.05, so there is not sufficient evidence to conclude that the proportion of stocks that went up is smaller than 62%.
Many investors and financial analysts believe the Dow Jones Industrial Average (DJIA) gives a good barometer of the overall stock market. On January 31, 2017, 9 of the 30 stocks making up the DJIA On the basis of this fact, a financial analyst claims we can assume that 62% of the stocks traded on the showed that 55 went up. You are conducting a study to see if the proportion of stocks that went up is significantly smaller than 62%. You use a significance level of a = 0.05. 1. For this study, we should use Select an answer 2. The null and alternative hypotheses would be: Họ: ? v Select an answer H: ? Select an answer (please enter a decimal) (Please enter a decimal) 3. The test statistic - (please show your answer to 3 decimal places.) 4. The p-value - (Please show your answer to 4 decimal places.) 5. The p-value is ? va 6. Based on this, we should Select an answer v the null hypothesis. 7. As such, the final conclusion is that... O The sample data suggest that the populaton proportion is significantly smaller than 62% at a - 0.05, so there is sufficient evidence to conclude that the proportion of stocks that went up is smaller than 62% O The sample data suggest that the population proportion is not significantly smaller than 62% at a - 0.05, so there is not sufficient evidence to conclude that the proportion of stocks that went up is smaller than 62%.

Glencoe Algebra 1, Student Edition, 9780079039897, 0079039898, 2018
18th Edition
ISBN:9780079039897
Author:Carter
Publisher:Carter
Chapter10: Statistics
Section10.6: Summarizing Categorical Data
Problem 10CYU

Related questions

Question
100%
Thanks
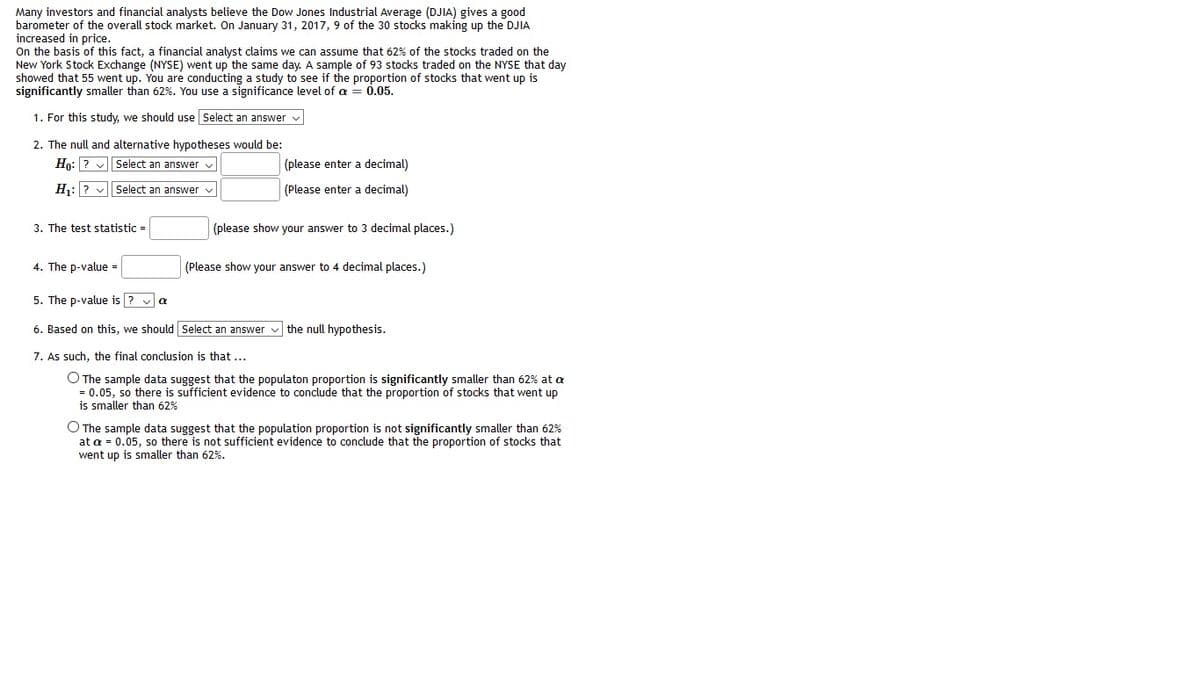
Transcribed Image Text:Many investors and financial analysts believe the Dow Jones Industrial Average (DJIA) gives a good
barometer of the overall stock market. On January 31, 2017, 9 of the 30 stocks making up the DJIA
increased in price.
On the basis of this fact, a financial analyst claims we can assume that 62% of the stocks traded on the
New York Stock Exchange (NYSE) went up the same day. A sample of 93 stocks traded on the NYSE that day
showed that 55 went up. You are conducting a study to see if the proportion of stocks that went up is
significantly smaler than 62%. You use a significance level of a = 0.05.
1. For this study, we should use Select an answer v
2. The null and alternative hypotheses would be:
Hn: ? v Select an answer v
(please enter a decimal)
Hj:? vSelect an answer v
(Please enter a decimal)
3. The test statistic =
(please show your answer to 3 decimal places.)
4. The p-value =
(Please show your answer to 4 decimal places.)
5. The p-value is ? va
6. Based on this, we should Select an answer
the null hypothesis.
7. As such, the final conclusion is that ...
O The sample data suggest that the populaton proportion is significantly smaller than 62% at a
= 0.05, so there is sufficient evidence to conclude that the proportion of stocks that went up
is smaller than 62%
O The sample data suggest that the population proportion is not significantly smaller than 62%
at a = 0.05, so there is not sufficient evidence to conclude that the proportion of stocks that
went up is smaller than 62%.
Expert Solution
This question has been solved!
Explore an expertly crafted, step-by-step solution for a thorough understanding of key concepts.

Step by step
Solved in 4 steps with 2 images

Knowledge Booster


Learn more about
Need a deep-dive on the concept behind this application? Look no further. Learn more about this topic, statistics and related others by exploring similar questions and additional content below.Recommended textbooks for you
Glencoe Algebra 1, Student Edition, 9780079039897…
Algebra
ISBN:
9780079039897
Author:
Carter
Publisher:
McGraw Hill

Holt Mcdougal Larson Pre-algebra: Student Edition…
Algebra
ISBN:
9780547587776
Author:
HOLT MCDOUGAL
Publisher:
HOLT MCDOUGAL
Glencoe Algebra 1, Student Edition, 9780079039897…
Algebra
ISBN:
9780079039897
Author:
Carter
Publisher:
McGraw Hill
Holt Mcdougal Larson Pre-algebra: Student Edition…
Algebra
ISBN:
9780547587776
Author:
HOLT MCDOUGAL
Publisher:
HOLT MCDOUGAL