
MATLAB: An Introduction with Applications
6th Edition
ISBN: 9781119256830
Author: Amos Gilat
Publisher: John Wiley & Sons Inc
expand_more
expand_more
format_list_bulleted
Related questions
Concept explainers
Question
selected answer is incorrect
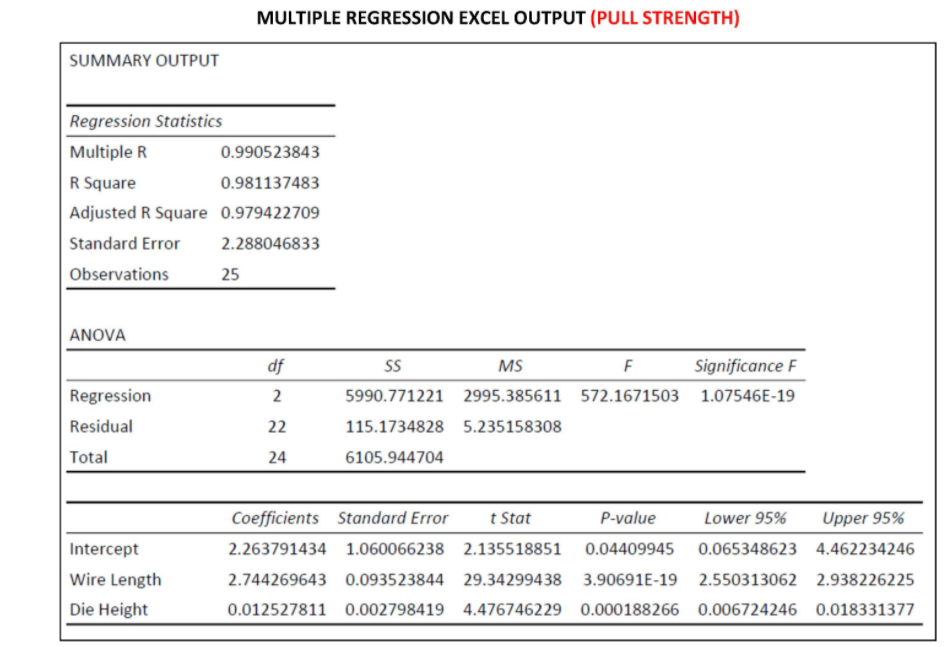

Transcribed Image Text:MULTIPLE REGRESSION EXCEL OUTPUT (PULL STRENGTH)
SUMMARY OUTPUT
Regression Statistics
Multiple R
0.990523843
R Square
0.981137483
Adjusted R Square 0.979422709
Standard Error
2.288046833
Observations
25
ANOVA
df
MS
F
Significance F
Regression
2
5990.771221 2995.385611 572.1671503 1.07546E-19
Residual
22
115.1734828 5.235158308
Total
24
6105.944704
Coefficients Standard Error
t Stat
P-value
Lower 95%
Upper 95%
Intercept
2.263791434 1.060066238 2.135518851
0.04409945
0.065348623 4.462234246
Wire Length
2.744269643 0.093523844
29.34299438
3.90691E-19
2.550313062 2.938226225
Die Height
0.012527811 0.002798419 4.476746229 0.000188266 0.006724246 0.018331377

Transcribed Image Text:Which of the following is a correct interpretation of the wire length
slope?
The pull strength is expected to increase by 2.744 units for every unit
increase in wire length, when die height is zero units.
The pull strength is expected to increase by 1 unit for every 2.744
units increase in wire length, when die height is zero units.
The pull strength is expected to increase by 1 unit for every 2.744
units increase in wire length, when die height is one unit.
The pull strength is expected to increase by 2.744 units for every unit
increase in wire length, when die height is kept constant.
The pull strength is expected to increase by 2.744 units for every unit
increase in wire length, when die height is one unit.
The pull strength is expected to increase by 1 unit for every 2.744
units increase in wire length, when die height is kept constant.
Expert Solution
This question has been solved!
Explore an expertly crafted, step-by-step solution for a thorough understanding of key concepts.

Step by stepSolved in 2 steps

Knowledge Booster


Learn more about
Need a deep-dive on the concept behind this application? Look no further. Learn more about this topic, statistics and related others by exploring similar questions and additional content below.Similar questions
arrow_back_ios
arrow_forward_ios
Recommended textbooks for you
- MATLAB: An Introduction with ApplicationsStatisticsISBN:9781119256830Author:Amos GilatPublisher:John Wiley & Sons Inc
 Probability and Statistics for Engineering and th...StatisticsISBN:9781305251809Author:Jay L. DevorePublisher:Cengage Learning
 Statistics for The Behavioral Sciences (MindTap C...StatisticsISBN:9781305504912Author:Frederick J Gravetter, Larry B. WallnauPublisher:Cengage Learning
  Elementary Statistics: Picturing the World (7th E...StatisticsISBN:9780134683416Author:Ron Larson, Betsy FarberPublisher:PEARSON
 The Basic Practice of StatisticsStatisticsISBN:9781319042578Author:David S. Moore, William I. Notz, Michael A. FlignerPublisher:W. H. Freeman
 Introduction to the Practice of StatisticsStatisticsISBN:9781319013387Author:David S. Moore, George P. McCabe, Bruce A. CraigPublisher:W. H. Freeman
MATLAB: An Introduction with Applications
Statistics
ISBN:9781119256830
Author:Amos Gilat
Publisher:John Wiley & Sons Inc
Probability and Statistics for Engineering and th...
Statistics
ISBN:9781305251809
Author:Jay L. Devore
Publisher:Cengage Learning
Statistics for The Behavioral Sciences (MindTap C...
Statistics
ISBN:9781305504912
Author:Frederick J Gravetter, Larry B. Wallnau
Publisher:Cengage Learning
Elementary Statistics: Picturing the World (7th E...
Statistics
ISBN:9780134683416
Author:Ron Larson, Betsy Farber
Publisher:PEARSON
The Basic Practice of Statistics
Statistics
ISBN:9781319042578
Author:David S. Moore, William I. Notz, Michael A. Fligner
Publisher:W. H. Freeman
Introduction to the Practice of Statistics
Statistics
ISBN:9781319013387
Author:David S. Moore, George P. McCabe, Bruce A. Craig
Publisher:W. H. Freeman