n the short run, at a market price of $20 per candle, this firm will choose to produce candles per day. On the preceding graph, use the blue rectangle (circle symbols) to shade the area representing the firm's profit or loss if the market price is $20 and he firm chooses to produce the quantity you already selected. Note: In the following question, enter a positive number, even if it represents a loss. The area of this rectangle indicates that the firm's would be s thousand per day in the short run.
n the short run, at a market price of $20 per candle, this firm will choose to produce candles per day. On the preceding graph, use the blue rectangle (circle symbols) to shade the area representing the firm's profit or loss if the market price is $20 and he firm chooses to produce the quantity you already selected. Note: In the following question, enter a positive number, even if it represents a loss. The area of this rectangle indicates that the firm's would be s thousand per day in the short run.

Principles of Microeconomics
7th Edition
ISBN:9781305156050
Author:N. Gregory Mankiw
Publisher:N. Gregory Mankiw
Chapter14: Firms In Competitive Markets
Section: Chapter Questions
Problem 10PA

Related questions
Question
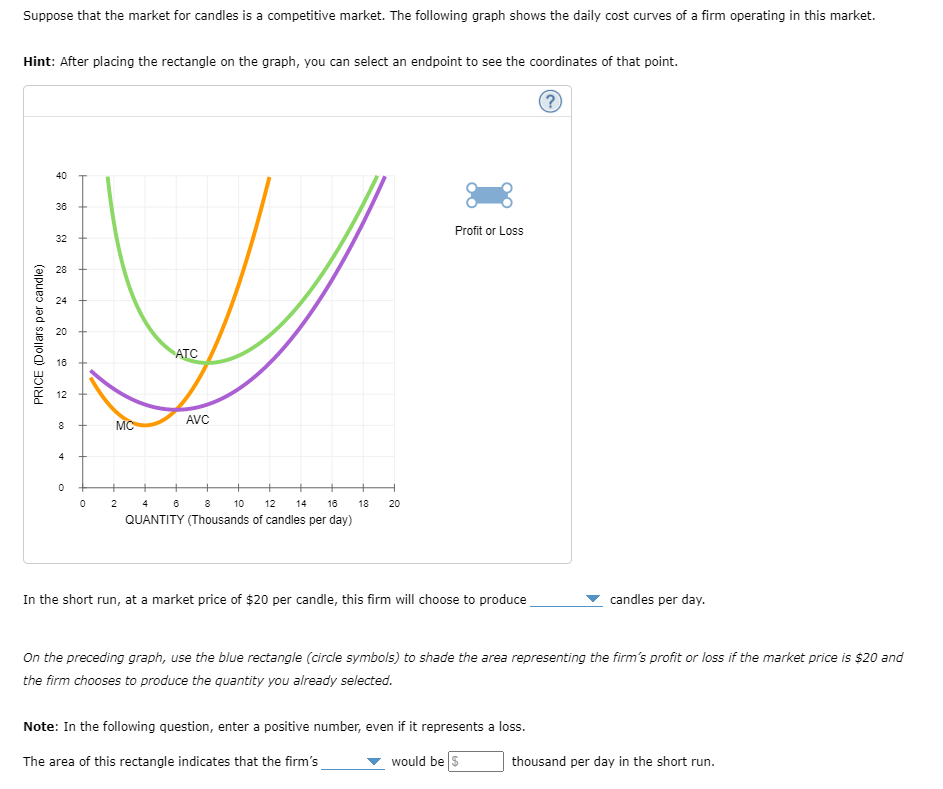
Transcribed Image Text:Suppose that the market for candles is a competitive market. The following graph shows the daily cost curves of a firm operating in this market.
Hint: After placing the rectangle on the graph, you can select an endpoint to see the coordinates of that point.
40
36
Profit or Loss
32
28
24
20
ATC
16
12
AVC
MC
4
8
2 4 6
QUANTITY (Thousands of candles per day)
10
12
14
16
18
20
In the short run, at a market price of $20 per candle, this firm will choose to produce
candles per day.
On the preceding graph, use the blue rectangle (circle symbols) to shade the area representing the firm's profit or loss if the market price is $20 and
the firm chooses to produce the quantity you already selected.
Note: In the following question, enter a positive number, even if it represents a loss.
The area of this rectangle indicates that the firm's
would be S
thousand per day in the short run.
PRICE (Dollars per candle)
Expert Solution
This question has been solved!
Explore an expertly crafted, step-by-step solution for a thorough understanding of key concepts.

This is a popular solution!

Trending now
This is a popular solution!

Step by step
Solved in 2 steps with 1 images

Knowledge Booster


Learn more about
Need a deep-dive on the concept behind this application? Look no further. Learn more about this topic, economics and related others by exploring similar questions and additional content below.Recommended textbooks for you
Principles of Microeconomics
Economics
ISBN:
9781305156050
Author:
N. Gregory Mankiw
Publisher:
Cengage Learning


Principles of Economics (MindTap Course List)
Economics
ISBN:
9781305585126
Author:
N. Gregory Mankiw
Publisher:
Cengage Learning
Principles of Microeconomics
Economics
ISBN:
9781305156050
Author:
N. Gregory Mankiw
Publisher:
Cengage Learning
Principles of Economics (MindTap Course List)
Economics
ISBN:
9781305585126
Author:
N. Gregory Mankiw
Publisher:
Cengage Learning

Essentials of Economics (MindTap Course List)
Economics
ISBN:
9781337091992
Author:
N. Gregory Mankiw
Publisher:
Cengage Learning

Principles of Economics, 7th Edition (MindTap Cou…
Economics
ISBN:
9781285165875
Author:
N. Gregory Mankiw
Publisher:
Cengage Learning

Principles of Microeconomics (MindTap Course List)
Economics
ISBN:
9781305971493
Author:
N. Gregory Mankiw
Publisher:
Cengage Learning