NIO 42 41 40 39 38 37 36 35 34 10 12 14 This gives the linear regression model of y = 0.16a +37.22 with R? = .0754 !! Where y is the price of NIO stock and is the number of days. (7 ) means day 0) %3D Use this model to predict the price of NIO stock on Day 12. Use this model to predict the price of NIO stock on Day 16. Based on the discussions in class, does this model fit the data well?
NIO 42 41 40 39 38 37 36 35 34 10 12 14 This gives the linear regression model of y = 0.16a +37.22 with R? = .0754 !! Where y is the price of NIO stock and is the number of days. (7 ) means day 0) %3D Use this model to predict the price of NIO stock on Day 12. Use this model to predict the price of NIO stock on Day 16. Based on the discussions in class, does this model fit the data well?

Functions and Change: A Modeling Approach to College Algebra (MindTap Course List)
6th Edition
ISBN:9781337111348
Author:Bruce Crauder, Benny Evans, Alan Noell
Publisher:Bruce Crauder, Benny Evans, Alan Noell
Chapter3: Straight Lines And Linear Functions
Section3.4: Linear Regression
Problem 12E: Remainder Round all answers to two decimal places unless otherwise indicated. Cell Phones The...

Related questions
Question
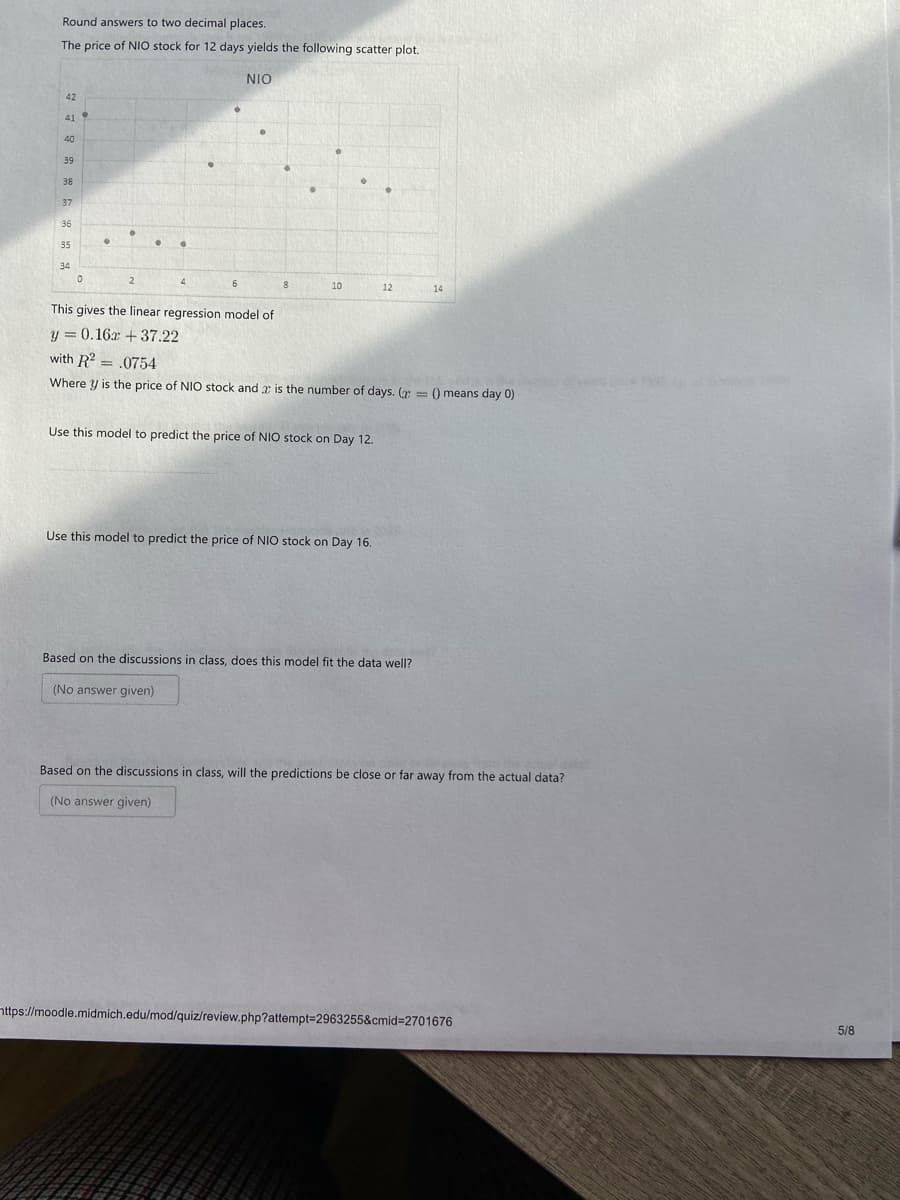
Transcribed Image Text:Round answers to two decimal places.
The price of NIO stock for 12 days yields the following scatter plot.
NIO
42
41
40
39
38
37
36
35
34
8.
10
12
14
This gives the linear regression model of
y = 0.16a +37.22
with R? = .0754
Where y is the price of NIO stock and x is the number of days. ( = 0 means day 0)
Use this model to predict the price of NIO stock on Day 12.
Use this model to predict the price of NIO stock on Day 16.
Based on the discussions in class, does this model fit the data well?
(No answer given)
Based on the discussions in class, will the predictions be close or far away from the actual data?
(No answer given)
nttps://moodle.midmich.edu/mod/quiz/review.php?attempt=2963255&cmid%3D2701676
5/8
Expert Solution
This question has been solved!
Explore an expertly crafted, step-by-step solution for a thorough understanding of key concepts.

Step by step
Solved in 2 steps

Recommended textbooks for you
Functions and Change: A Modeling Approach to Coll…
Algebra
ISBN:
9781337111348
Author:
Bruce Crauder, Benny Evans, Alan Noell
Publisher:
Cengage Learning

Glencoe Algebra 1, Student Edition, 9780079039897…
Algebra
ISBN:
9780079039897
Author:
Carter
Publisher:
McGraw Hill

Functions and Change: A Modeling Approach to Coll…
Algebra
ISBN:
9781337111348
Author:
Bruce Crauder, Benny Evans, Alan Noell
Publisher:
Cengage Learning
Glencoe Algebra 1, Student Edition, 9780079039897…
Algebra
ISBN:
9780079039897
Author:
Carter
Publisher:
McGraw Hill

Algebra and Trigonometry (MindTap Course List)
Algebra
ISBN:
9781305071742
Author:
James Stewart, Lothar Redlin, Saleem Watson
Publisher:
Cengage Learning

College Algebra
Algebra
ISBN:
9781305115545
Author:
James Stewart, Lothar Redlin, Saleem Watson
Publisher:
Cengage Learning

Algebra & Trigonometry with Analytic Geometry
Algebra
ISBN:
9781133382119
Author:
Swokowski
Publisher:
Cengage