Now evaluate the null hypothesis that the population means for all treatments are equal. At a significance level of a = 0.05, the null hypothesis is .You find that you conclude that the direction that the stroller faces influences a child's expressive vocabulary at 36 months. Now you decide to use a t test to test the hypothesis that there is no difference between the groups. The estimated standard error (SM1 - Mzis 5.13, so the t test statistic is Use the following tool to find the critical regions for a = 0.05.
Now evaluate the null hypothesis that the population means for all treatments are equal. At a significance level of a = 0.05, the null hypothesis is .You find that you conclude that the direction that the stroller faces influences a child's expressive vocabulary at 36 months. Now you decide to use a t test to test the hypothesis that there is no difference between the groups. The estimated standard error (SM1 - Mzis 5.13, so the t test statistic is Use the following tool to find the critical regions for a = 0.05.

Glencoe Algebra 1, Student Edition, 9780079039897, 0079039898, 2018
18th Edition
ISBN:9780079039897
Author:Carter
Publisher:Carter
Chapter10: Statistics
Section10.6: Summarizing Categorical Data
Problem 27PPS

Related questions
Question
Chapter 12 problem #12
Transcribed Image Text:Now evaluate the null hypothesis that the population means for all treatments are equal. At a
significance level of a = 0.05, the null hypothesis is
. You find that
you
conclude that the direction that the stroller faces influences a child's expressive
vocabulary at 36 months.
Now you decide to use a t test to test the hypothesis that there is no difference between the
groups. The estimated standard error (SM1 - Mzis 5.13, so the t test statistic is
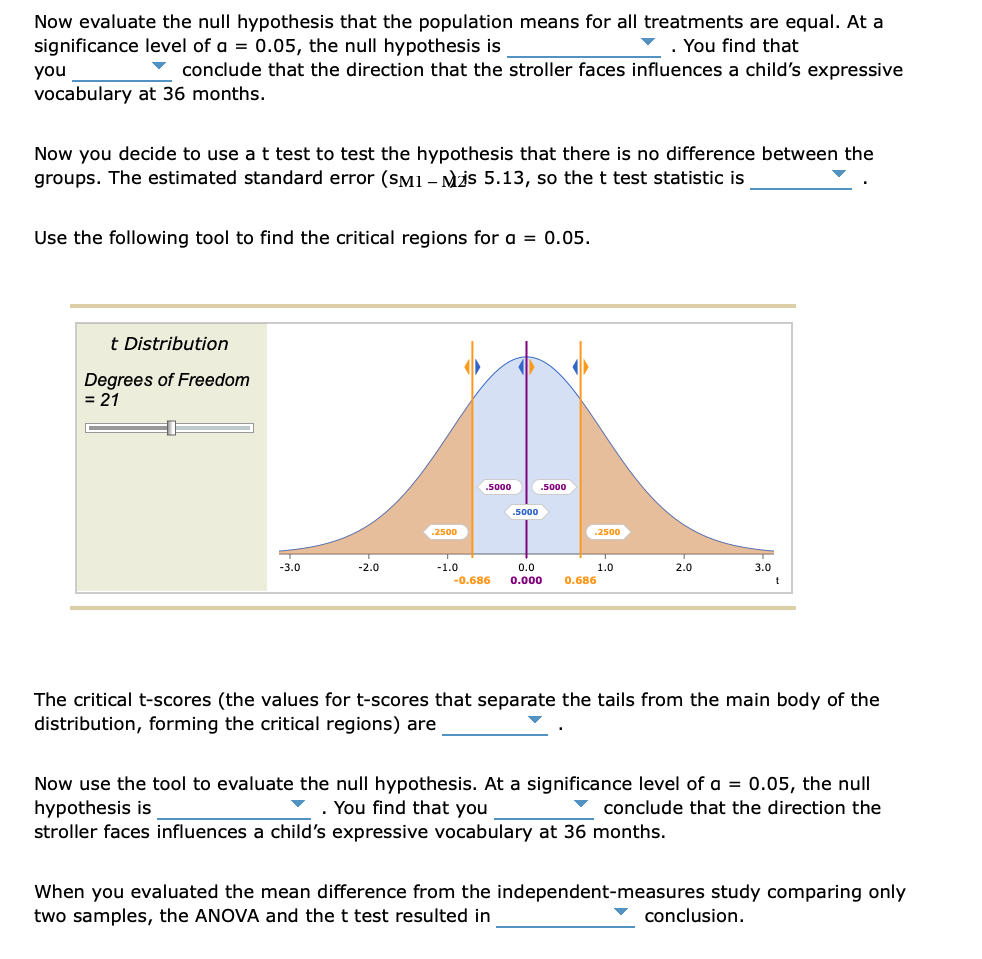
Use the following tool to find the critical regions for a = 0.05.
t Distribution
Degrees of Freedom
= 21
-3.0
-2.0
.2500
.5000
-1.0
.5000
.5000
.2500
0.0
-0.686 0.000 0.686
1.0
2.0
3.0
t
The critical t-scores (the values for t-scores that separate the tails from the main body of the
distribution, forming the critical regions) are
Now use the tool to evaluate the null hypothesis. At a significance level of a = 0.05, the null
hypothesis is
. You find that you
conclude that the direction the
stroller faces influences a child's expressive vocabulary at 36 months.
conclusion.
When you evaluated the mean difference from the independent-measures study comparing only
two samples, the ANOVA and the t test resulted in
Transcribed Image Text:Suzanne Zeedyk, a developmental psychologist at Dundee University's School of Psychology,
conducted a pilot study in which parents started a half-hour walk with their infants in a parent-
facing or an away-facing stroller and then switched to the other type of stroller midway. Her results
suggest that parents talked less to the babies, the babies had higher heart rates, and they were
less likely to fall asleep in away-facing strollers than in parent-facing strollers.
You are interested in testing the hypothesis that babies who travel in parent-facing strollers have
different expressive vocabularies than babies who travel in away-facing strollers. You randomly
assign 12 newborns to parent-facing strollers and 12 newborns to away-facing strollers. You then
test the babies' expressive vocabularies at age 36 months using the Expressive Vocabulary Test
(EVT), which is designed primarily to assess children's expressive vocabulary.
The sample means and sums of squares of the scores for each of the groups are presented in the
following table.
Group
Away-facing
Parent-facing
Sample Mean Sum of Squares
2,064.59
1,404.59
You decide to use an ANOVA at a = 0.05 to test the null hypothesis that there is no difference
between the groups. The ANOVA table follows. Calculate the F-ratio and enter it into the table.
Within Treatments
Total
ANOVA Table
Source of Variation Sum of Squares Degrees of Freedom
Between Treatments
1
22
23
98.1
106.2
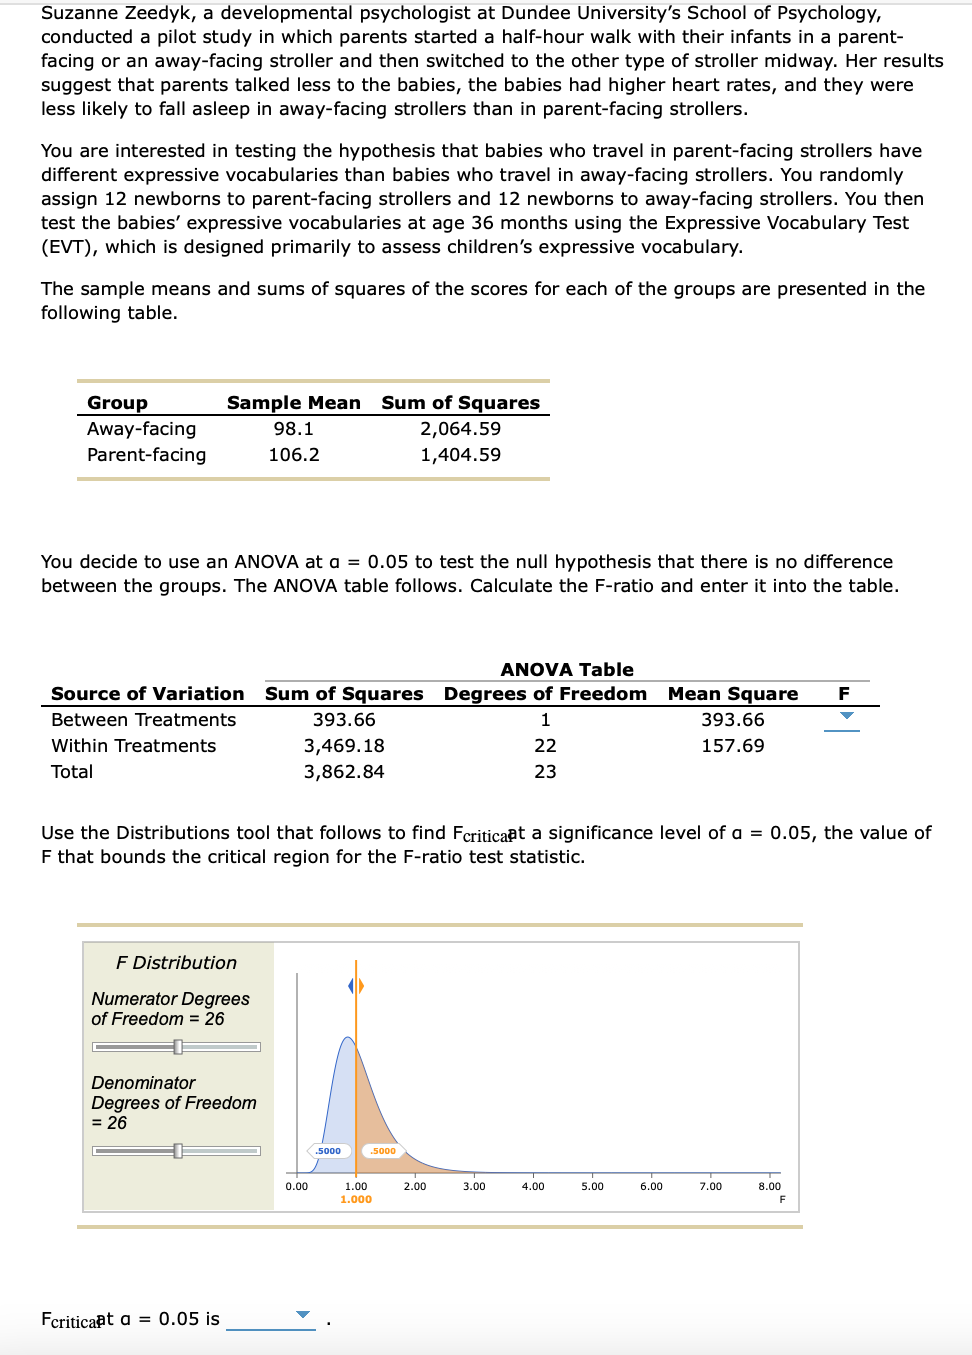
F Distribution
Numerator Degrees
of Freedom = 26
Denominator
Degrees of Freedom
= 26
Fcriticaat a = 0.05 is
Use the Distributions tool that follows to find Fcriticaat a significance level of a = 0.05, the value of
F that bounds the critical region for the F-ratio test statistic.
393.66
3,469.18
3,862.84
0.00
.5000
.5000
1.00
1.000
2.00
3.00
4.00
5.00
Mean Square F
393.66
157.69
6.00
7.00
8.00
F
Expert Solution
This question has been solved!
Explore an expertly crafted, step-by-step solution for a thorough understanding of key concepts.

This is a popular solution!

Trending now
This is a popular solution!

Step by step
Solved in 3 steps with 2 images

Recommended textbooks for you
Glencoe Algebra 1, Student Edition, 9780079039897…
Algebra
ISBN:
9780079039897
Author:
Carter
Publisher:
McGraw Hill
Glencoe Algebra 1, Student Edition, 9780079039897…
Algebra
ISBN:
9780079039897
Author:
Carter
Publisher:
McGraw Hill