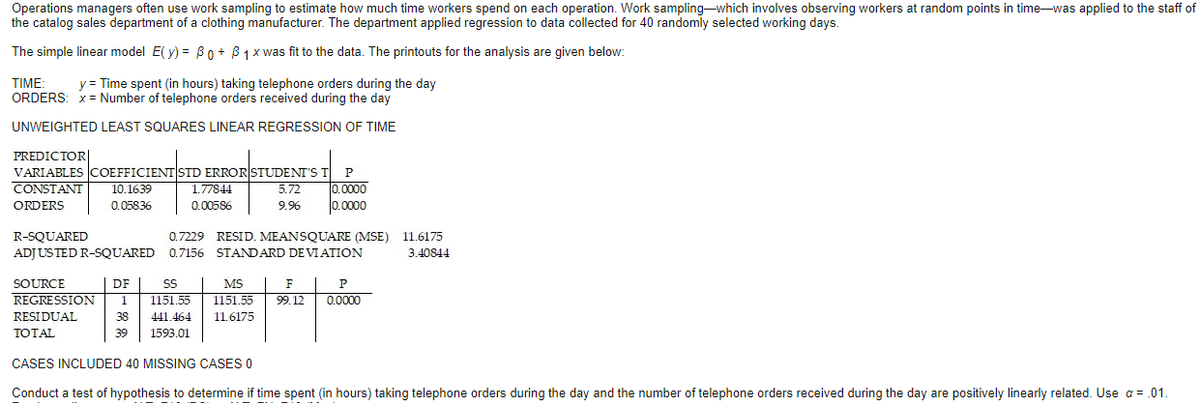
Operations managers often use work sampling to estimate how much time workers spend on each operation. Work sampling-which involves observing workers at random points in time-was applied to the sta the catalog sales department of a clothing manufacturer. The department applied regression to data collected for 40 randomly selected working days. The simple linear model E( y) = Bo+ B1x was fit to the data. The printouts for analysis are given below: TIME: ORDERS: X= Number of telephone orders received during the day y = Time spent (in hours) taking telephone orders during the day UNWEIGHTED LEAST SQUARES LINEAR REGRESSION OF TIME PREDICTOR| VARIABLES COEFFICIENT STD ERROR STUDENT'S T CONSTANT 10.1639 0.05836 1.77844 0.00586 0.0000 0.000 5.72 ORDERS 9.96 R-SQUARED 0.7229 RESID. MEANSQUARE (MSE) 11.6175 ADJ US TED R-SQUARED 0.7156 STANDARD DE VIATION 3.40844 FI P | DF 1151.55 SOURCE MS REGRESSION 1151.55 99. 12 0.0000 RESIDUAL 38 441.464 11.6175 TOTAL 39 1593.01 CASES INCLUDED 40 MISSING CASES O Conduct a test of hypothesis to determine if time spent (in hours) taking telephone orders during the day and the number of telephone orders received during the day are positively linearly related. Use a = .01.


Correlation
Correlation defines a relationship between two independent variables. It tells the degree to which variables move in relation to each other. When two sets of data are related to each other, there is a correlation between them.
Linear Correlation
A correlation is used to determine the relationships between numerical and categorical variables. In other words, it is an indicator of how things are connected to one another. The correlation analysis is the study of how variables are related.
Regression Analysis
Regression analysis is a statistical method in which it estimates the relationship between a dependent variable and one or more independent variable. In simple terms dependent variable is called as outcome variable and independent variable is called as predictors. Regression analysis is one of the methods to find the trends in data. The independent variable used in Regression analysis is named Predictor variable. It offers data of an associated dependent variable regarding a particular outcome.


Trending now
This is a popular solution!

Step by step
Solved in 2 steps with 2 images


