Panel (a) 1e+07- 1e+06 - te+05 - 2015 2016 2017 2018 Date Panel (b) 1e+07- 1e+06 - 1e+05- 2015 2016 2017 2018 Date Plots of total volume sold over time total_volume_sold total_volume_sold


Q: A survey was conducted by a researcher to study the impact of per capita gross national product…
A: Given that: IMR^=14.83-0.85FemLit-0.97GNP-0.72FemLit×GNP 1.23 1.64 3.45…
Q: Not long ago, a popular car magazine raced a Dodge Viper SRT- 10 on an airport runway to see how…
A:
Q: (a) What is a log-log plot?(b) If a log-log plot of your data lies approximately on a line, what…
A: (a) Consider the data points (m,n)When a graph is plotted between log m and log n, then the plot is…
Q: Based on the scatterplot and computer output, a reasonable estimate for the stock price for week 95…
A: Given : Constant = 2.0583 Coefficient of weeks = 0.0022
Q: Use the logarithmic regression capability of your calculator to find a logarithmic model for this…
A:
Q: At the beginning of the COVID-19 pandemic, the virus spread at an exponential rate. The CDC began to…
A: A regression line is used to relate the response variable with the explanatory variable. There are…
Q: The average annual salary of an NBA player increased from $170 thousand in 1980 to $2.6 million in…
A: Let the exponential relationship between years (t) and Annual salary (S) is given by S = AeBt + E…
Q: Complete the table** 1) A sample of data is collected (from 1999 and 2000) concerning the…
A: Solution: Given information: n= 1000 observation. k= 6 independent variables p= 7 total number of…
Q: The table gives estimated concentrations (in micrograms per milliliter) of the drug piroxicam taken…
A: Part a):The logarithmic model for C(x) is of the form
Q: a database consisting of 108 monthly observations on automobile accidents for Trinidad and Tobago…
A: Given Chart of OLS chart Find a parts
Q: The table shows the annual revenue from area Walmart stores (in millions of dollars). Amount, y…
A: The given table data is Year Amount, y 2003 12.92 2004 14.70 2005 16.18 2006 17.64 2007…
Q: When rabbits were introduced to the continent of Australia they quickly multiplied and spread across…
A: Using the Standard Formula of Exponential Regression:
Q: Find a natural logarithm regression equation for the data in Table 1.16 and superimpose its graph on…
A: Year Cubic Feet(trillions 1997 5.76 1998 5.98 1999 6.26 2000 6.47 2001 6.60
Q: Here is a table of some logarithm values. 1. What is the approximate value of log,, 400? 2. What is…
A: Given query is to find value of log10400 and log101000.
Q: In an analysis of two independent samples, log transformation has been applied to original data so…
A: Given the calculated sample mean difference of the log-transformed data between two samples is 5.87.
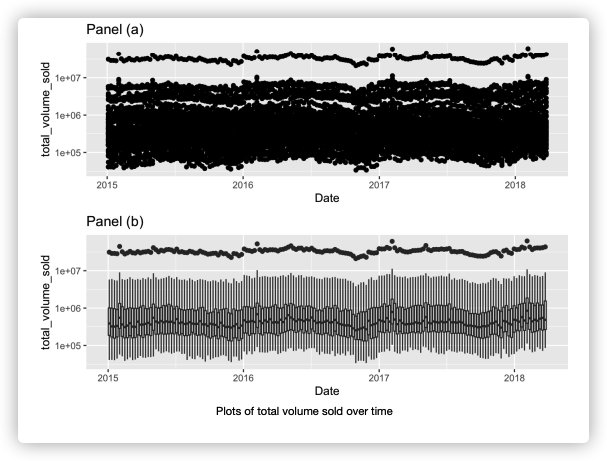
Q: The Figure above shows two different panels comparing how the total volume sold of conventional…
A: 1D and 2D Histograms • hist2d(M, N, n)—Returns a two-dimensional histogram with n bins on…
Q: Not long ago, Car and Driver magazine ran several sports cars as fast as they could down a 1-mile…
A: Given information: The data represents the values of the variables x = Time (sec) and y = Speed…
Q: an equivalent logarithmic equation.
A: Given that: The equation is e - 8.6 = h.
Q: The following data pertain to the growth of a colony of bacteria in a culture medium: A) Plot log…
A: A) The data inserted in EXCEL is defined below:
Q: The table shows the total personal income in the United States (in billions of dollars) for selected…
A: The data for total personal income in U.S is, Year Income ($ billions) 1960 411.5 1970 838.8…
Q: For Exercises 35-38, a graph of data is given. From visual inspection, which model would best fit…
A: Consider the graph of the question 35. Find which model would best fit among: y=mx+b, y=abx, y=a+bln…
Q: Consider the plot of the total number E of Ebola cases in West Africa reported to the Centers for…
A:
Q: a scuba diver used her camera equipment to measure the intensity of light, in lux, as she dove into…
A: Use the given data to form the excel table: x y ln x ln^2 (x) y*ln x y = a + b*lnx 5 2.3…
Q: p (psi) 20 30 40 50 60| 70 80 V (f) 82 54 41 32 27 23 20 Determine the relationship for the curve of…
A: Reviewing information, Given, p=(20,30,40,50,60,70,80) v=(82,54,41,32,27,23,20)
Q: The table lists the Consumer Price Index for all U.S. urban consumers (CPI-U) with 1982–1984 = 100…
A: Enter the given table values in excel sheet and get the required function using trend lines option…
Q: Complete the following table. Rewrite the given Exponential Equations as Logarithmic Equations and…
A:
Q: The table below gives the U.S. population for selected years from 1950 to 2010. Year 1950 1960 1970…
A: The exponential regression technique uses a dataset to determine an exponential function, y=abx such…
Q: The numbers of polio cases in the world are shown in the table for various years. Year Number of…
A:
Q: im having trouble with this one
A: (a) Use spreadsheet to obtain the log equation for the given data as shown in below figure.Frist…
Q: The table shows the total personal income in the United States (in billions of dollars) for selected…
A: Solution:
Q: Ever since the start of the 21st century, life expectancy has steadily increased. The table below…
A: Given information: The table representing the life expectancy based on the year between 2000-2020…
Q: The life expectancies of black males in the United States at various ages for 2006 are as shown…
A: Hey, since there are multiple questions posted, we will answer first question. If you want any…
Q: For Exercise, a graph of data is given. From visual inspection, which model would best fit the data?…
A: Solution : Graph of data is given. Shape (Graph) of Different equations - 1) y=mx+b (Linear)…
Q: Consider the following model to explain the percentage of students receiving a passing score on a…
A: Given information: The output of multiple linear regression is given.
Q: A popular social media platform has begun offering stock shares to the public. In the past 2 years,…
A: Here, given that the data is exponentially distributed. The exponential model is given by, y= a*bx…
Q: lan Stewart included the following as among the 17 equations that changed the world, EXCEPT Golden…
A: 17 equations that changed the world by Ian Stewart are 1. Pythagoras's Theorem 2. Logarithms 3.…
Q: The life expectancies of black males in the United States at various ages for 2006 are as shown…
A: a) At birth age=0 So coordinate are (0,69.7) and (60,18.2). We find the average rate of change…
Q: Because of past use of leaded gasoline, the concentration of lead in soil can be associated with how…
A: (a) Obtain the log model for the given data as follows.Let the log model be L(x) = A + Bln(x).…
Q: complete the following question on using logarithmic scales. how many times more intense is an…
A: Given, Earthquake of magnitude 6.5 than an earthquake of magnitude 3.9.
Q: the following data set involves logarithmic growth. Determine the missing value x - 1, 2.7, 7.4,…
A: consider the logarithmic function
Q: The Warren Theater in Moore has determined the number of tickets that could be sold to a special…
A:
Q: The equation of the exponential function that models a data set is y = 78.20(0.87) Determine the…
A: Given
Q: Because of past use of leaded gasoline, the concentration of lead in soil can be associated with how…
A:
Q: A quality control team studies the relationship between years of experience (x) for individual…
A:
Q: why does the value d(y) not matter when estimating theta for a member of the linear exponential…
A:
Q: On a logarithmic axis, the midpoint between the tick mark labeled 10 and that labeled 100 is?
A:
Q: Let grad be a dummy variable for whether a student-athlete at a large university graduates in five…
A: Given model is, grad=-1.17+0.24hsGPA+0.00058SAT+0.0073study Given that hsGPA=3 SAT=1200 The estimate…
Q: Students in a learning theory study were given an exam and then retested monthly for 6 months with…
A: Since you have posted a question with multiple subparts, we will solve the first three subparts for…
Q: If we multiply the data values by a constant (say, c), how this will affect the geometric mean? use…
A: From the given information, It has been given that,
Q: In Section 1.4 we modeled the world population from 1900 to 2010 with the exponential function P(t)…
A:
The Figure above shows two different panels comparing how the total volume sold of conventional avocados change over time (note that both plots are plotted on a log scale).
a)Which of the two panels, (a) or (b), best shows the pattern of total volume sold? Explain your answer.
b)Would a 2D histogram make sense to use for summarizing this particular relationship? Briefly explain why or why not.

Step by step
Solved in 2 steps

- Exact reducibleIndia is staring at a human catastrophe of unimaginable proportions what's gone wrong how could the nation that seemed to have overcome the first COVID wave last year is now down on its knees Death, devastation, desperation,and despair has permeated the lives of 1.3 billion people in india as the second wave of the COVID 19 pandemic hit the country with immense ferocity Around 400,000 new cases and more than 4,000 deaths have been reported on many days in May. A.With the data given on the documentary, calculate the incidence rate of COVID-19 cases on the month of May per 100,000 population of India. Show your solution.Gulf Coast Electronics is ready to award contracts to suppliers for providing reservoir capacitors for use in its electronic devices. For the past several years, Gulf Coast Electronics has relied on two suppliers for its reservoir capacitors: Able Controls and Lyshenko Industries. A new firm, Boston Components, inquired into the possibility of providing a portion of the reservoir capacitors needed by Gulf Coast. The quality of products provided by Lyshenko Industries has been extremely high; in fact, only 0.5% of the capacitors provided by Lyshenko had to be discarded because of quality problems. Able Controls has also had a high quality level historically, producing an average of only 1% unacceptable capacitors. Because Gulf Coast Electronics has had no experience with Boston Components, it estimated Boston’s defective rate to be 10%. Gulf Coast would like to determine how many reservoir capacitors should be ordered from each firm to obtain 75,000 acceptable-quality capacitors to use…
- pls asap its about mathematical methods with physicGram Schmidt processThe cashier line of a canteen can facilitate up to 60 customers an hour. Frequenters of thecanteen arrive at an average of 50 an hour. Suppose that management wants toevaluate the desirability of opening a second order-processing station so that twocustomers can be served simultaneously. Assume a single waiting line with the firstcustomer in line moving to the first available server.a. What is the average arrival time in minutes of customers?b. What is the average service time in minutes of the canteen?c. What is the probability that the canteen has a customer?d. What is the probability that the canteen does not have any customer?e. How long would the line be on average (average number of customers in thesystem)?f. How many people are waiting to be served on average?g. How long in minutes would it take the customer from lining up until he leaves thewaiting line?h. How long in minutes would a customer wait to be served on average?i. Find the probability that there are 7 customers in the…
- 4.) IntegrateDefinite Integ.The annual energy consumption in billions of Btu for both natural gas and coal is shown for a random selection of states. 4. If 500 billion Btu of natural gas is used then what is the projected amount of coal that is used? The projected amount of coal that is used is _______billion Btu. (Round answer to THREE decimal places)
- General Directi0n: F0r activities that involve solution to problems, perform the steps in conducting hypothesis testing such as stating of problems and hypothesis, and so on.A population of protozoa develops with a constant relativegrowth rate of 0.7944 per member per day. On day zero thepopulation consists of two members. Find the populationsize after six days.Kolkmeyer Manufacturing Company is considering adding two machines to its manufacturing operation. This addition will bring the number of machines to nine. The president of Kolkmeyer asked for a study of the need to add a second employee to the repair operation. The arrival rate is 0.05 machines per hour for each machine, and the service rate for each individual assigned to the repair operation is 0.4 machines per hour. Mention the queuing model that can be implemented for the analysis (notation of Kendall) and why that model was chosen
