Use exponential smoothing with a smoothing constant of 0.3 to forecast the demand for fertilizer in year 12. Assume that last period's forecast for year 1 is 5,000 bags to begin the procedure. Bags are shown in 1,000's in table below. Year Demand (Bags) 4 6. 3. 4 10 6. 8. 7. 8. 8. 6. 12 10 14 11 15 O A. 14.00 B. 14.87 O C. 11.79 D. 13.67
Use exponential smoothing with a smoothing constant of 0.3 to forecast the demand for fertilizer in year 12. Assume that last period's forecast for year 1 is 5,000 bags to begin the procedure. Bags are shown in 1,000's in table below. Year Demand (Bags) 4 6. 3. 4 10 6. 8. 7. 8. 8. 6. 12 10 14 11 15 O A. 14.00 B. 14.87 O C. 11.79 D. 13.67

Managerial Economics: Applications, Strategies and Tactics (MindTap Course List)
14th Edition
ISBN:9781305506381
Author:James R. McGuigan, R. Charles Moyer, Frederick H.deB. Harris
Publisher:James R. McGuigan, R. Charles Moyer, Frederick H.deB. Harris
Chapter5: Business And Economic Forecasting
Section: Chapter Questions
Problem 7E: The Questor Corporation has experienced the following sales pattern over a 10-year period: Compute...

Related questions
Question
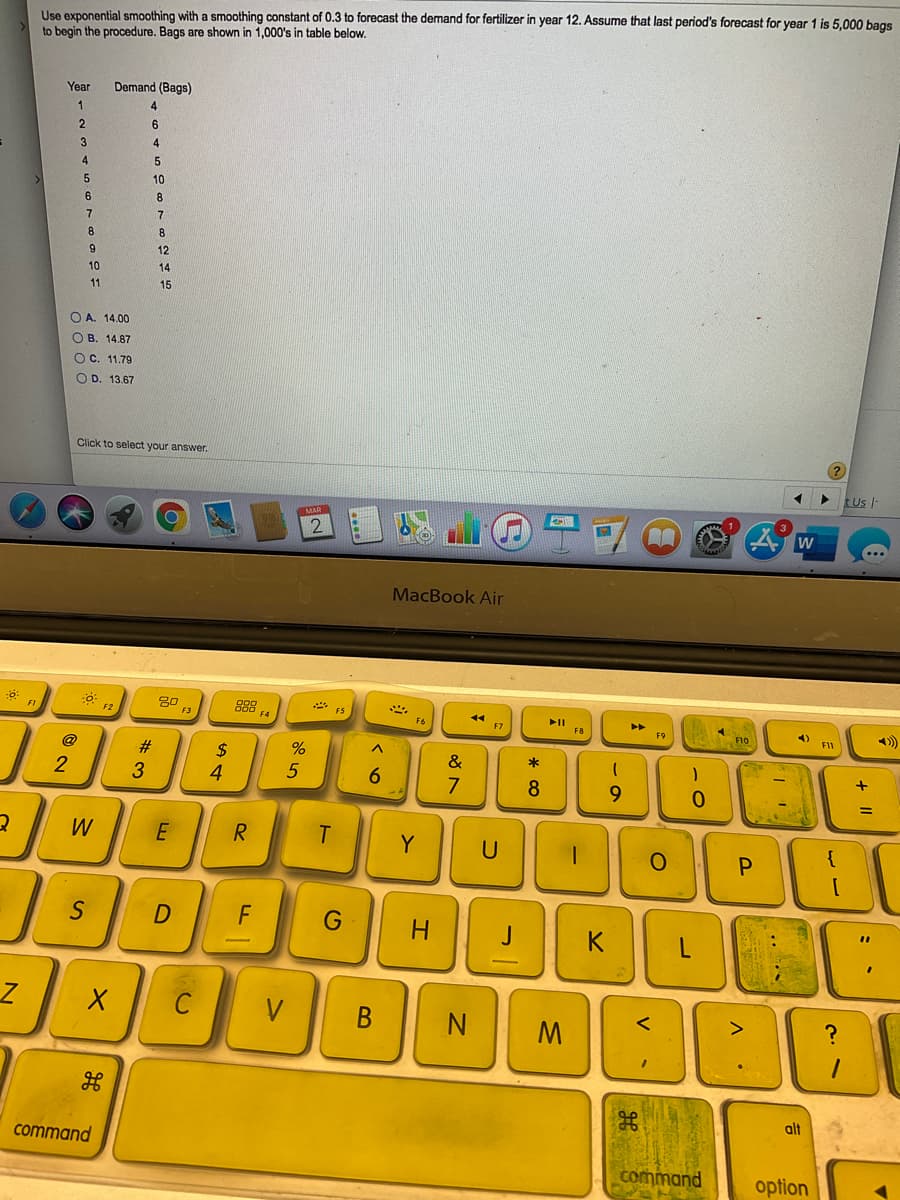
Transcribed Image Text:Use exponential smoothing with a smoothing constant of 0.3 to forecast the demand for fertilizer in year 12. Assume that last period's forecast for year 1 is 5,000 bags
to begin the procedure. Bags are shown in 1,000's in table below.
Year
Demand (Bags)
6
3
4.
4.
5
10
6
8.
7
7
8
9
12
10
14
11
15
O A. 14.00
ОВ. 14.87
OC. 11.79
O D. 13.67
Click to select your answer.
tUs I
MacBook Air
80
F3
888
* ES
F4
44
F7
F2
F6
F8
>)
FIO
F11
@
#3
24
4
&
2
6.
7
8
9.
0.
W
R
Y
U
P.
F
G
H
%3D
K
C
V
N
alt
command
command
option
* co
Expert Solution
This question has been solved!
Explore an expertly crafted, step-by-step solution for a thorough understanding of key concepts.

This is a popular solution!

Trending now
This is a popular solution!

Step by step
Solved in 2 steps

Knowledge Booster


Learn more about
Need a deep-dive on the concept behind this application? Look no further. Learn more about this topic, economics and related others by exploring similar questions and additional content below.Recommended textbooks for you
Managerial Economics: Applications, Strategies an…
Economics
ISBN:
9781305506381
Author:
James R. McGuigan, R. Charles Moyer, Frederick H.deB. Harris
Publisher:
Cengage Learning
Managerial Economics: Applications, Strategies an…
Economics
ISBN:
9781305506381
Author:
James R. McGuigan, R. Charles Moyer, Frederick H.deB. Harris
Publisher:
Cengage Learning