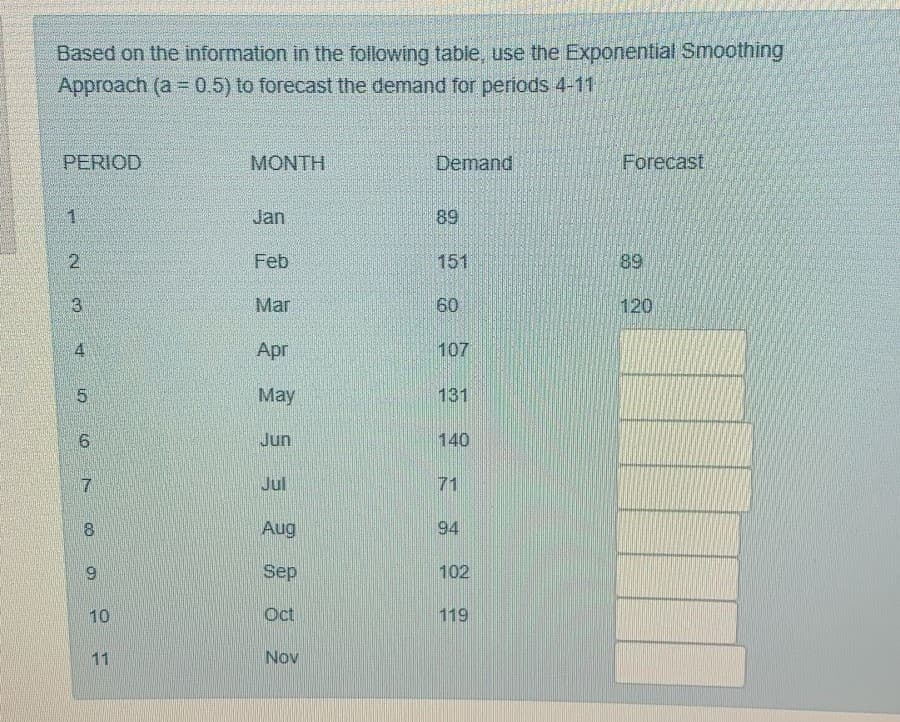
Based on the information in the following table, use the Exponential Smoothing Approach (a =0.5) to forecast the demand for periods 4-11 PERIOD MONTH Demand Forecast 1 Jan 89 2 Feb 151 89 Mar 60 120 4. Apr 107 May 131 Jun 140 7. Jul 71 8. Aug 94 Sep 102 10 Oct 119 11 Nov 3. 9,


Q: If a $200 increase in price is associated with an increase in quantity of 50 visits, with regard to…
A: The need or desire to own goods or services is known as demand in economics. Demand is affected by…
Q: A bank predicts the total amount of deposits based on the Federal Reserve Prime Interest Rate. The…
A: R^2 is also called goodness of fit. It tells how well the regression model is fitted in the data…
Q: Consider the following actual (A) and forecast (F) demand levels for a commercial multiline…
A: Actual demand refers to the demand that turns out be true in a given year. Forecast demand refers to…
Q: As the selling price of a product increases, demand decreases. Fewer people will buy a product if it…
A: Total revenues is got by price times sales. If total revenues is given, we solve the quadratic…
Q: The number of heart surgeries performed at Heartville General Hospital has increased steadily over…
A: Exponential smoothing is often utilized for the analysis of time-series data. Exponential smoothing…
Q: The demand function for apples is the following. Qn = 10 – Pn + 0.2Y +0.5 Pc – 2Ps + 0.2A Where:…
A: As given Qn = 10 – Pn + 0.2Y +0.5 Pc – 2Ps + 0.2A Also we know that income elasticity is Ey =…
Q: Below is a table containing data on product demand for the most recent three months along with the…
A: MSE stands for mean squared error which is used to estimate how close a regression line to a set of…
Q: Consider the following demand data. Penod 2. 3. 4. 6. 6. 10 demand 130 452 428 470 478 Use Holt's…
A: The forecast can be calculated by the below formula: Ft+1= Dt+Dt-1+Dt-2/3 F = Forecast D = Demand F…
Q: DEMAND (UNITS) 4,130 4,230 3,930 4,330 4,930 4,630 5,230 4,830 5,330 5,630 MONTH January February…
A: Regression Model (Linear): Let Y = a + bx be the Liner Regression Equation. Y= Forecast, b is the…
Q: A manager uses a trend equation plus quarterly relatives to predict demand. Quarter relatives are…
A: MAD=MEAN ABSOLUTE DEVIATION mean absolute deviation of a dataset is the average distance between…
Q: Demand and supply in a market are described by the equation: Qd=66-3P Qs=-4+2P Solvealgebraically…
A: Demand equation: Qd = 66 - 3P Supply equation: Qs = -4 + 2P
Q: How do I calculate new Qs for supply and demand?
A: A market demand schedule and market demand curve helps to determine the change in demand. A market…
Q: 1. You work for a beer company. Your boss wants to increase yearly sales by 5000 liters. To reach…
A: 1) It is given that the price and the demographic composition of market is constant. Hence these two…
Q: Use simple exponential smoothing with a = 0.6 to forecast the tire sales for September through…
A: Forecasting sales refers to the prediction of future sales using previous data to estimate the…
Q: Look at Figure, which shows the inverse relationship between ticket prices and game attendance at…
A: As per the law of demand, price and quantity demanded are inversely related. If the price rises, the…
Q: Two different forecasting techniques (F1 and F2) were used to forecast demand for cases of bottled…
A:
Q: Use exponential smoothing with a smoothing constant of 0.3 to forecast the demand for fertilizer in…
A: We are going to use exponential smoothing method to answer this question.
Q: a) The following information pertains to a consumption bundles (x₁, x₂) and prices (P₁, P2) faced by…
A: Paasche Price Index is defined as - Pp = p1x1 (t)+ p2x2 (t)p1(b)x1(t)+ p2(b)x2(t) Lasperyres Price…
Q: lon 4 A potter makes and sells ceramic bowls. It is observed that when the price is $32, only 9…
A:
Q: The daily demand for a product X is estimated to be: Q$ = 100 – 3Px+4P,– 0.01M + 2A, %3D Where P =…
A: The given demand function of X is Qxd=100-3Px+4Py-0.01M+2Ax Put the given values in this function to…
Q: The ABC Toy Company makes a few types of toy cars on one of its production line. Based on orders…
A:
Q: Part C 3. The manager of a certain gasoline station wants to forecast the demand for the unleaded…
A: Exponential smoothed forecast for demand from April to November when α = 0.25 Exponential smoothed…
Q: The problem is based on the following data given. Observations of the demand for a certain part…
A: Moving Average is a method to estimate future value on the basis of past values. It is used to…
Q: Consider the following actual and forecast demandlevels for Big Mac hamburgers at a local McDonald’s…
A: The following formula will calculate the forecast for the big mac demand for Friday.
Q: 2. Gorgeousleny purchased a combination of 15 breads and 5 juices with her income of P150 and price…
A: Given , Price of bread = 6 Price of juice = 12 Initially she buy 15 breads and 5 juices But now ,…
Q: 2. A store can sell 40 widgets per week at $8 each and 25 widgets at $13 each. a. Find the demand…
A: Answer: Given, Price (P) Quantity (Q) $8 (P1) each 40 widgets per week (Q1) $13 (P1) each 25…
Q: Based on the information in the following table, use the Weighted moving average Approach to…
A: Given : Month weight demand Sep 1 161 Oct 2 122 Nov 3 106
Q: Mr. Jones sells scrapbooking materials. He charges $20 per album and sells 120 albums month at this…
A: Demand shows the inverse relationship between price and quantity demanded.
Q: forecasts? 7. Contrast the use of MAD and MSE in evaluating forecasts. 8. What advantages as a…
A: 7. Introduction MAD (Mean Absolute Deviation) is a measure of variability which measures how far…
Q: Demand and Supply model In the notes and lessons, we saw that quantity demanded and quantity…
A: Given: Pn+1-Pn =α (Dn - Pn), Dn+1-Dn =β (Pn - Dn) Pn=level production after n time intervals, Dn =…
Q: Suppose thata researcher, by using a sample of transactions of residential houses, wants to estimate…
A: Economics as a subject deals with the allocation of scarce resources among humans with unlimited…
Q: The Eastern Shuttle, Inc., is a regional airline providing shuttle service between New York and…
A: The demand curve represents the relationship between price and quantity demanded. For normal goods,…
Q: Consider that the quantity of Milk A sold will increase by 50%, the sales revenue of Milk A will…
A: In the mentioned question we have been asked to calculate the price of Milk A of april when there is…
Q: Ypsilanti Market Research conducted a survey to find out whether people who earn more money purchase…
A: According to the question, it is said that : A graph is given that indicates the relationship…
Q: The demand function for apples is the following. Qn = 10 – Pn + 0.2Y +0.5 Pc – 2Ps + 0.2A Where:…
A: Given Qn = 10 – Pn + 0.2Y +0.5 Pc – 2Ps + 0.2A
Q: Suppose consumers will demand 40 units of product when the price is $12 and 25 units when the price…
A: Standard form of demand function is Q = a - b P, which shows that there is an inverse relationship…
Q: Multiple Choice the use of predictive analytics. a concentrated retail system. a high elasticity of…
A: Elastic demand implies there is a significant change in amount requested when one more monetary…
Q: The demand of a product of a company is given below for the past periods. Can we use Winter method…
A: Demand: Demand refers to the willingness to buy a commodity at a particular time and at a particular…
Q: Suppose that a store decreases the price of laundry detergent from $4.10 to $3.50. As a result,…
A:
Q: The demand of a product of a company is given below for the past periods. Can we use Winter method…
A: No, we cannot use winter's model to find the forecast here because of the missing information…
Q: A stadium can seat 60,000 people. Assume 35% of seats are not occupied (not for sale) because of…
A: Market demand is linear means there is a linear relationship between quantity demanded and price.…
Q: According to Exhibit A-5, what is the relationshipbetween the price per pizza and the quantityof…
A: OPTION B - INVERSE Price per pizza and quantity of pizzas purchased are inversely related according…
Q: 4. An electrical contractor's records during the last five weeks indicate the number of job…
A: * SOLUTION :- (4) Given that ,
Q: b. Is the World heading for a recession? Explain the conditions under which the world can be…
A: The economic cycle is being characterized by the four phases namely expansion, peak, contraction and…
Q: In March 2021, sales of disposable flavored e-cigarettes were 8.25 million devices. The average…
A:
Q: Q2. a. What is the law of demand? Give two examples of how you have observed the law of demand at…
A: What is the law of demand? Give two examples of how you have observed the law of demand at work in…

Step by step
Solved in 2 steps


- Suppose that you work for a U.S. senator who is contemplating writing a bill that would put a national sales tax in place. Because the tax would be levied on the sales revenue of retail stores, the senator has asked you to prepare a forecast of retail store sales for year 8, based on data from year 1 through year 7. The data are: (c1p2) Year Retail Store Sales 1 $1,225 2 1,285 3 1,359 4 1,392 5 1,443 6 1,474 7 1,467 54 Chapter One a. Use the first naive forecasting model presented in this chapter to prepare a forecast of retail store sales for each year from 2 through 8. b. Prepare a time-series graph of the actual and forecast values of retail store sales for the entire period. (You will not have a forecast for year 1 or an actual value for year 8.) c. Calculate the root-mean-squared error for your forecast series using the values for year 2 through year 7. 3. Use the second naive forecasting model presented in this chapter to answer parts (a) through (c) of Exercise 2. Use P 0.2 in…A local moving company has collected data on the number of moves they have been asked to perform over the past two years. Moving is highly seasonal, so the owner/operator, who is both burly and highly educated, decides to apply the multiplicative seasonal method to forecast the number of customers for the coming year. The equation for the trend line of yearly sales is Ft = 16 + 60t. Please forecast demand for each quarter in Year 3. (Round the forecasts to whole numbers and show all calculations). Complete the table below and forecast the sales of Year 3 by quarter. Year 1 Year 2 Year 3 Quarter Demand Seasonal Index Quarter Demand Seasonal Index Average Seasonal Index Forecast 1 20 1 27 2 40 2 45 3 45 3 55 4 31 4 41 Total AverageAD has estimated the following demand relationship for its product over the last four years, using monthly observations: ln Qt = 4.932- 1.238 ln Pt + 1.524 ln Yt-1 + 0.4865lnQt-1(2.54) (1.38) (3.65) (2.87)R2= 0.8738where Q = sales in units, P = price in Rs., Y is income in Rs,000, and the numbers in brackets are t-statistics.a. Interpret the above model.b. Make a sales forecast if price is Rs. 9, income last month was Rs. 25,000 and sales last month were 2,981 units.c. Make a sales forecast for the following month if there is no change in price or income.d. If price is increased by 5 per cent in general terms, estimate the effect on sales, stating any assumptions.
- 21. Consider a firm subject to quarter-to-quarter variation in its sales. Suppose that the following equation was estimated using quarterly data for the period 2011–2018 (the time variable goes from 1 to 32). The variables D1, D2, and D3 are, respectively, dummy variables for the first, second, and third quarters (e.g., D1 is equal to 1 in the first quarter and 0 otherwise). Qt =a+bt+c1D1+c2D2+c3D3 The results of the estimation are presented here: a. Calculate the intercept in each of the four quarters. What do these values imply? b. Use this estimated equation to forecast sales in the fourth quarter of 2019.Consider the following actual and forecast demandlevels for Big Mac hamburgers at a local McDonald’s restaurant:DAY ACTUAL DEMAND FORECAST DEMANDMonday 88 88Tuesday 72 88Wednesday 68 84Thursday 48 80FridayThe forecast for Monday was derived by observing Monday’sdemand level and setting Monday’s forecast level equal to this demand level. Subsequent forecasts were derived by using expo-nential smoothing with a smoothing constant of 0.25. Using this exponential smoothing method, what is the forecast for Big Macdemand for Friday?is the world heading for a recession? explain the conditons under which the world can be classified as being in a recession as COVID-19 persists. explain linking the pandemic to the various stages of a recession
- Consider the following model: yhat = 2.6+-0.9x² The prediction of y is yhat. What is the estimated marginal effect of x on y when x=2.7? PLZ MAKE SURE THIS IS RIGHT!!!A firm keeps a record of sales and prices over the past seven months, resulting in the following table: Price (ZMW/ton) Sales (tons) Nov. 1985 7.5 84.5 Dec. 8.0 82.0 Jan. 1986 8.0 84.0 Feb. 7.2 92.0 March 7.0 95.0 April 8.0 92.0 May 8.5 91.5 Use these observations to estimate demand as a linear function of both price and time. Further, utilise this function to estimate demand for the following month, on the assumption that: (a) price remains unchanged, (b) price increases to ZMW9/ton. Hence estimate the price elasticity of demand between these prices and find the price which would maximise sales revenue. Given the nature of the observations, comment on any difficulties in interpreting your results for decision-making purposes.A firm experienced the demand shown in the following table. *Unkown future value to be forecast Fill in the table by preparing forecasts based on a five-year moving average, a three-year moving average, and exponential smoothing (with a w=0.9 and a w=0.3). Note The exponential smoothing forecasts may be begun by assuming Y t+1=Yt. Using the forecasts from 2005 through 2009, compare the accuracy of each of the forecasting methods based on the RMSE criterion. Which forecast would you have used for 2010? Why?
- The Questor Corporation has experienced the following sales pattern over a 10-year period: Compute the equation of a trend line (similar to Equation 5.4) for these sales data to forecast sales for the next year. (Let 2004=0,2005=1, etc., for the time variable.) What does this equation forecast for sales in the year 2014? Use a first-order exponential smoothing model with a w of 0.9 to forecast sales for the year 2014.Metropolitan Hospital has estimated its average monthly bed needs as N=1,000+9X where X=timeperiod(months);January2002=0 N=monthlybedneeds Assume that no new hospital additions are expected in the area in the foreseeable future. The following monthly seasonal adjustment factors have been estimated, using data from the past five years: Forecast Metropolitans bed demand for January, April, July, November, and December 2007. If the following actual and forecast values for June bed demands have been recorded, what seasonal adjustment factor would you recommend be used in making future June forecasts?Bell Greenhouses has estimated its monthly demand for potting soil to be the following: N=400+4X where N=monthlydemandforbagsofpottingsoil X=timeperiodsinmonths(March2006=0) Assume this trend factor is expected to remain stable in the foreseeable future. The following table contains the monthly seasonal adjustment factors, which have been estimated using actual sales data from the past five years: Forecast Bell Greenhouses demand for potting soil in March, June, August, and December 2007. If the following table shows the forecasted and actual potting soil sales by Bell Greenhouses for April in five different years, determine the seasonal adjustment factor to be used in making an April 2008 forecast.