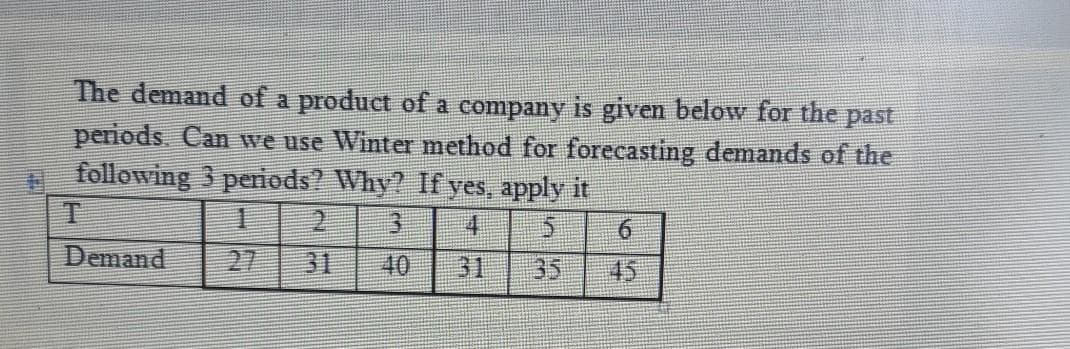
The demand of a product of a company is given below for the past periods. Can we use Winter method for forecasting demands of the H following 3 periods? Why? If yes, apply it 3. 4. 6. Demand 27 31 40 31 35 45


Q: Slope, b1 = MSE= c. What is the forecast for t = 8? If required, round your answer to three decimal…
A: *Answer: *b Here, the sample size is n = 7. Now, obtain the following table for necessary…
Q: Consider the following model: yhat = 2.6+-0.9x² The prediction of y is yhat. What is the estimated…
A: y = 2.6 + (-0.9x2) => y = 2.6 - 0.9x2 Differentiate y w.r.t x => dy / dx = -0.9 (2)x => dy…
Q: The use of quarterly data to develop the forecasting model Yt = a +bYt-1 is an example of which…
A: The forecasting refers to the prediction technique for a certain situation taking into consideration…
Q: 13% RECESSION 12 11 10 9. 8 7 יוי1דיוידד 1965'70 '75 '80 '85 '90 '952000 '05 '10 '15 '20 how do you…
A: Recession is the economic situation when economy is in downtrend and slowdown phase only for…
Q: A bank predicts the total amount of deposits based on the Federal Reserve Prime Interest Rate. The…
A: R^2 is also called goodness of fit. It tells how well the regression model is fitted in the data…
Q: Jan '20 0.68 Feb '20 0.76 Mar '20 1.6 Apr '20 1.47 May '20 0.98 Jun '20 1.18 Jul '20 3.59 Aug '20…
A: 1) Simple Moving Average (SMA): A simple moving average is a statistical tool that simply calculates…
Q: Below is a table containing data on product demand for the most recent three months along with the…
A: MSE stands for mean squared error which is used to estimate how close a regression line to a set of…
Q: 1. How is the judgmental forecasting executed? 2. How is judgmental forecasting relevant in making…
A: Business forecasting alludes to the devices and procedures used to foresee advancements in business,…
Q: Consider the following demand data. Penod 2. 3. 4. 6. 6. 10 demand 130 452 428 470 478 Use Holt's…
A: The forecast can be calculated by the below formula: Ft+1= Dt+Dt-1+Dt-2/3 F = Forecast D = Demand F…
Q: A manager uses a trend equation plus quarterly relatives to predict demand. Quarter relatives are…
A: MAD=MEAN ABSOLUTE DEVIATION mean absolute deviation of a dataset is the average distance between…
Q: Use simple exponential smoothing with a = 0.6 to forecast the tire sales for September through…
A: Forecasting sales refers to the prediction of future sales using previous data to estimate the…
Q: Campus Advising needs to allocate time this week for office appointments, so she needs te forecast…
A: Economics is a branch of social science that describes and analyzes the behaviors and decisions…
Q: Lauren’s Beauty Boutique has experienced the followingweekly sales: Week Sales1 4322…
A: Given; Week Sales1 4322 3963 4154 4585 460
Q: lon 4 A potter makes and sells ceramic bowls. It is observed that when the price is $32, only 9…
A:
Q: You own a restaurant near the beach. Business has been growing each year, but obviously spikes…
A: The regression equation gives a mathematical form to the association or link between two or more…
Q: Simple Regression Sales Revenue Year Product Price (P) (millions of pesos) 1 1.20 0.95 1.50 0.93 3…
A: Regression is a statistical technique used in finance, investing, and other fields to identify the…
Q: Choose one of the following forecasting methods discussed in this chapter: last-value, averaging,…
A: Exponential smoothing is commonly used to make short term forecasts, yet longer-term estimates…
Q: What is a probit model vrs. a logit model?
A: Probit and Logit model are used when we need to predict or analyze the binary dependent variable.In…
Q: Consider the following actual and forecast demandlevels for Big Mac hamburgers at a local McDonald’s…
A: The following formula will calculate the forecast for the big mac demand for Friday.
Q: Discuss how you would conduct sales forecasting when working with government aganecy. Be sure to…
A: Sales: It refers to the goods and services that have been available to the public for purchase. The…
Q: onential Smoothing with the following parameters: Ft+1=32 and the α = .15 Regression Months 1 2 3 4…
A: *Answer: . Forecasts are useful tools for making predictions and analyzing future outcomes.…
Q: A local moving company has collected data on the number of moves they have been asked to perform…
A: The equation for the trend line of yearly sales is given: Ft = 16 + 60t
Q: Two coincident indicators used in forecasting
A: A coincident pointer is a metric that shows the present status of financial movement inside a…
Q: A police station had to deploy a police officer for an emergency multiple times in the last four…
A: Forecast for Friday using naive approach = Actual demand of previous period(Thursday) = 12.
Q: Question 4 Consider the following data: Month Bicycles Sold 21.6 2. 22.9 25.5 21.9 23.9 6. 27.5 7…
A: We are going to calculate Mean Absolute Percentage Error using its formula and definition.
Q: The circulation C of a certain magazine as a function of time t is given by the formula…
A: Time period can be calculated by using the following function. Time period (t) is calculated by…
Q: Director Very Busy needs to allocate time this week for office appointments, so he needs to forecast…
A: Economics is a branch of social science that describes and analyzes the behaviors and decisions…
Q: forecasts? 7. Contrast the use of MAD and MSE in evaluating forecasts. 8. What advantages as a…
A: 7. Introduction MAD (Mean Absolute Deviation) is a measure of variability which measures how far…
Q: Fiting a straght ne to a set of data yields he following prediction ine. Complete (a through ()…
A: Given Predicted line Yi⏞=4+7Xi⏞ .........(1)
Q: Next Stândard Period Error Forecasting Method Used Forecast (MSE) 1.3-period UnWMA 10.42 3.24…
A: Given:
Q: c. What would be this week's forecast for employee appointments using exponential smoothing with…
A: Economics is a branch of social science that describes and analyzes the behaviors and decisions…
Q: Define Forecasts and forecast errors in time series anaylsis?
A: Time series analysis is a technique in statistics that deals with trend analysis or time series…
Q: 4. Relate cycles, seasonality and trends in time series forecasting. What is their relevance in such…
A: Note:- Dear learner you have posted two questions, as per our policy we will solve only first…
Q: Historical demand for the product is: Month Demand January 12 February 11 March 15 April 12 May 16…
A: Month Demand Weights Weighted average April 12 0.1 12*0.1 =1.2 May 16 0.3 16*0.3=4.8 June…
Q: Suppose we have the following time series data on variable Y (where t = trend): t Y 1 100 2 120 3…
A: Given: t y (At) 1 100 2 120 3 160 4 200 α=0.5
Q: Question 3 We run the following model: cigarette,+Bymale, + we find that the R2 is 0.12 and the SSR…
A: Question 1: cigarette=B0+B1price+e B0: When the price of the cigarette is zero, the number of…
Q: The demand of a product of a company is given below for the past periods. Can we use Winter method…
A: Demand: Demand refers to the willingness to buy a commodity at a particular time and at a particular…
Q: Assume the following AR(1) Y, = 0.036 + 0.69Y,-1 + E Suppose you have data for t-1, let's say Y,I =…
A: * SOLUTION :- *(8)
Q: Director Very Busy needs to allocate time this week for office appointments, so he needs to forecast…
A: Economics is a branch of social science that describes and analyzes the behaviors and decisions…
Q: This graph shows the seasonal factor taken out of the series after performing the decomposition.…
A: In the given graph, the data is centered at 0 to make it consistent. This is because of the reason…
Q: (a) Specify a model for housing starts that accounts for possible trends and seasonalit in the…
A: DISCLAIMER “Since you have asked multiple question, we will solve the first three question for you…
Q: How Forecasts is compared with predicted values? why these both terms are different?
A: A forecast is an estimation that is based on the previous data. A prediction is estimating the…
Q: stion 16 A moderating variable influences the original relationship between one or more independent…
A: Moderating variables is that variables modify the original relationship between one or more…
Q: The following is the data of recent refrigerator sales at a local Home Depot store. Month 1 2 3…
A: Weighted moving averages assign a heavier weighting to more current data points since they are more…
Q: 4. An electrical contractor's records during the last five weeks indicate the number of job…
A: * SOLUTION :- (4) Given that ,
Q: b. Is the World heading for a recession? Explain the conditions under which the world can be…
A: The economic cycle is being characterized by the four phases namely expansion, peak, contraction and…
Q: Based on the information in the following table, use the Exponential Smoothing Approach (a =0.5) to…
A: Use the below formula: Ft+1=αDt + 1 + αFt Ft+1=forecast for next period Dt=actual demand for…
Q: From the following data relating to the number of letters posted a port office find the seasonal…
A: In the mentioned question we have to calculate seasonal variations using the method of simple…
Economic

Step by step
Solved in 2 steps


- Consider the following time series data: Month 1 2 3 4 5 6 7 Value 24 13 20 12 19 23 15 Compute MSE using the most recent value as the forecast for the next period. What is the forecast for month 8? Compute MSE using the average of all the data available as the forecast for the next period. What is the forecast for month 8? Which method appears to provide the better forecast?Based on annual data from 2000-2010, the Gadget Company estimates that sales are growing according to a linear trend: Q = 50,000 + 200t where t is time and t = 0 in 2000. a. Forecast sales for 2013. b. Do you see any problems with this forecasting method?Define Forecasts and forecast errors in time series anaylsis?
- Historical demand for Peeps is as displayed in the table. Month Demand January 11 February 18 March 31 April 39 May 44 June 53 July 67 August 82 September 96 Develop forecasts from June through October using these techniques: Holt's method with alpha=0.2 and beta=0.1. For Holt's model, the level and trend for May are assumed to be 44 and 12. Judge which forecast method is the best based on MAD.A researcher has a sample of 6 annual observations {94, 104, 102, 99, 111 and 107} for the CPI in country Z for the period 2015 to 2020, and wants to forecast CPI for the years 2021, 2022 and 2023. The researcher uses 3 different forecasting models: A, B and C. Model A is an AR(1) model with no drift and with an estimated autoregressive coefficient = 0.7. Model B is a MA(1) model with no constant and with an estimated MA coefficient = -0.4 (note the minus !). Model C is a random walk model with no drift. The error terms over the 2015-2020 period were estimated to have the values: {3, -1, 2, 4, -3, 1}. a. Compute the 2021, 2022 and 2023 forecasted values for the consumer price index based on the three models. Show the formulas and the details of your calculations, and explain all the related symbols. b. Suppose that the actual values of the CPI over the 2021, 2022 and 2023 were {108, 114, 105}. Calculate the Root mean square error of the three model forecasts over the 2021-2023…Can you explain what these two belows mean in regard of GMM and Maximum likelihood. What are we calculating and what is it used to Unconstrained optimizationConstrained optimizatio
- (Ch7) If the mean time between in-flight aircraft engine shutdowns is 12,500 operating hours, what is the 90 percentile on the distribution of the number of hours until the next shutdown? (hint: convert the mean time between events to the mean events per hour λ, then apply inverse exponential) Question 7Select one: a. 20,180 hours b. 18,724 hours c. 23,733 hours d. 28,782 hours5 True/False/uncertain 7) With all observations in the same cluster, RSQ = 1. 8) With 500 multiple imputation samples generating 500 predictions of 0 or 1 for the binary dependent variable for each observation, to combine the 500 predictions into one for each observation, one has to take the mean of all 500 predictions and use a cutoff of 50%.(Ch7) True or False? We should use a normal distribution to model the number of years until the next Florida hurricane strike.