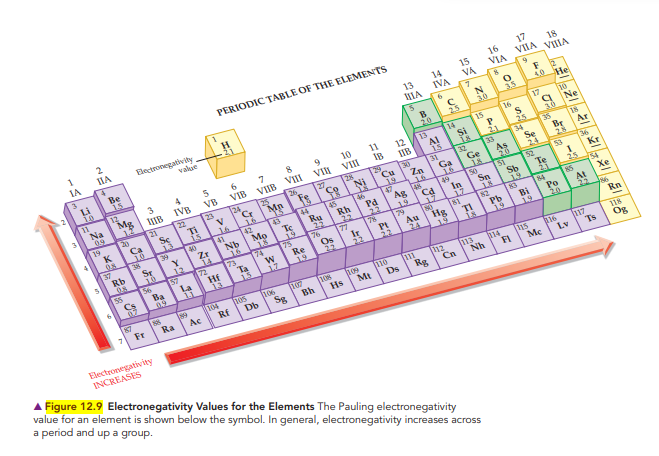
PERIODIC TABLE OF THE ELEMENTS 15 VA 16 VIA 17 18 VIIA VIIIA 2 13 14 IIA Blectronegativity vakue IVA IA 6 Be 15 N 3.0 35 40 He Li B 20 25 12 3 8 17 TO 16 S 25 34 Se 6 9 10 11 15 Mg 1.2 13 14 Si Na IIB IVB VB 12 Ne VIB VIIB VIII VII VI 24 Cr 30 18 Br 18 IIB 22 23 2.1 15 31 Ga 16 49 Ca 26 27 20 19 K 129 Se V 16 32 133 Ge Ti Ar 25 36 Kr 4 10 19 Zn As 24 42 43 44 4S 20 41 37 53 Ru 50 151 Sn 18 Rh Pd Ag 152 Nb 1.6 73 Mo Sr 10 56 Ba Rb Zr 1.8 25 22 19 79 Pt 14 In 1.7 Sb Te 12 25 54 Xe 76 77 23 84 Po 20 1.9 75 Re 19 74 78 72 La 55 Os Ir Ta 15 Au Hf 13 Hg 15 17 22 22 22 Pb 1.9 24. TI is Bi At 19 Rn 7 Fr 106 Db Ra Ac Rf Sg Bh 112 114 117 Hs Mt Ds Rg Cn Nh FI Lv Ts Og Electronegativity INCREASES A Figure 12.9 Electronegativity Values for the Elements The Pauling electronegativity value for an element is shown below the symbol. In general, electronegativity increases across a period and up a group. en E


Types of Chemical Bonds
The attractive force which has the ability of holding various constituent elements like atoms, ions, molecules, etc. together in different chemical species is termed as a chemical bond. Chemical compounds are dependent on the strength of chemical bonds between its constituents. Stronger the chemical bond, more will be the stability in the chemical compounds. Hence, it can be said that bonding defines the stability of chemical compounds.
Polarizability In Organic Chemistry
Polarizability refers to the ability of an atom/molecule to distort the electron cloud of neighboring species towards itself and the process of distortion of electron cloud is known as polarization.
Coordinate Covalent Bonds
A coordinate covalent bond is also known as a dative bond, which is a type of covalent bond. It is formed between two atoms, where the two electrons required to form the bond come from the same atom resulting in a semi-polar bond. The study of coordinate covalent bond or dative bond is important to know about the special type of bonding that leads to different properties. Since covalent compounds are non-polar whereas coordinate bonds results always in polar compounds due to charge separation.
Refer to the values in Figure 12.9 and calculate the electronegativity difference in a S¬I bond.

Step by step
Solved in 2 steps


