
Computer Networking: A Top-Down Approach (7th Edition)
7th Edition
ISBN: 9780133594140
Author: James Kurose, Keith Ross
Publisher: PEARSON
expand_more
expand_more
format_list_bulleted
Related questions
Question
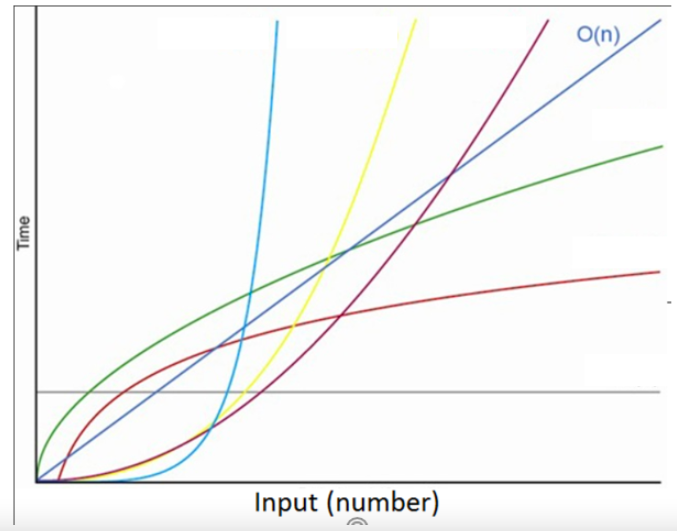

Transcribed Image Text:The image displays a graph illustrating the growth of different functions with respect to input size, commonly used in analyzing algorithm complexity in computer science.
### Key Components of the Graph:
- **Axes**:
- The horizontal axis represents the input size, labeled as "Input (number)."
- The vertical axis represents time complexity or computation time, labeled as "Time."
- **Curves**: The graph contains several curves, each representing a different complexity class:
- **Red Curve**: Typically represents constant time complexity, O(1), where execution time is unaffected by input size.
- **Green Curve**: Often used for logarithmic time complexity, O(log n), which grows slowly as input size increases.
- **Yellow Curve**: Depicts linear time complexity, O(n), where time grows linearly with input size.
- **Blue Curve**: Demonstrates quadratic time complexity, O(n²), showing a parabolic growth pattern.
- **Violet Curve**: Sometimes used for exponential time complexity, O(2^n), indicating rapid growth as input size increases.
- **Annotations**:
- The graph includes a label "O(n)" near the violet curve, indicating a linear complexity line for reference.
These complexity classes are fundamental in understanding how algorithms scale and perform with larger inputs. Assessing the growth of these curves helps in evaluating the efficiency and feasibility of algorithms in practical applications.

Transcribed Image Text:Pictured above are graphs representing algorithmic complexity of Big Oh notation functions. Assign the following labels to the appropriate graph. There will be two labels per graph. O(n) is done as an example.
| Big Oh notation | Algorithmic growth |
|-----------------|---------------------|
| Dark Blue | O(n) | linear |
| Light Blue | | |
| Yellow | | |
| Purple | | |
| Green | | |
| Brown | | |
| Gray | | |
Expert Solution
This question has been solved!
Explore an expertly crafted, step-by-step solution for a thorough understanding of key concepts.

This is a popular solution

Trending nowThis is a popular solution!

Step by stepSolved in 3 steps

Knowledge Booster

Similar questions
- The Polish mathematician Wacław Sierpiński described the pattern in 1915, but it has appeared in Italian art since the 13th century. Though the Sierpinski triangle looks complex, it can be generated with a short recursive function. Your main task is to write a recursive function sierpinski() that plots a Sierpinski triangle of order n to standard drawing. Think recursively: sierpinski() should draw one filled equilateral triangle (pointed downwards) and then call itself recursively three times (with an appropriate stopping condition). It should draw 1 filled triangle for n = 1; 4 filled triangles for n = 2; and 13 filled triangles for n = 3; and so forth. API specification. When writing your program, exercise modular design by organizing it into four functions, as specified in the following API: public class Sierpinski { // Height of an equilateral triangle whose sides are of the specified length. public static double height(double length) // Draws a filled equilateral…arrow_forwardUse the Java programming langauge if neededarrow_forwardPython: Graph Colouring A simple method to find a colouring of a graph, with vertices {0,1,…,?−1}, is the following greedy algorithm: For ? in 0, 1, 2, ..., n - 1: Find the smallest colour (positive integer) ? which is not a colour of any neighbour of ?. Assign ? as the colour of ?. i) Implement the method above as a function greedy_colouring which takes a networkx Graph G (with vertices {0,1,…,?−1}) and returns a list C of the colours of G, where C[i] is the colour of vertex ?. ii) As a test, the Hoffman-Singleton graph (nx.hoffman_singleton_graph()) should require 6 colours using this method. If you have a graph G, you can draw it with coloured vertices using the code below: ten_colours = ['#CC6677', '#332288', '#DDCC77', '#117733', '#88CCEE', '#882255', '#44AA99', '#999933', '#AA4499', '#DDDDDD'] nx.draw_networkx(G, node_color=[ten_colours[i - 1] for i in greedy_colouring(G)], with_labels=False) iii) One way of refining the…arrow_forward
- 7- A student has created a plot of y(t)=t^2. He needs to show another graph of z(t)=t^3 in the same plot. But every time he hits the plot() function- MATLAB generates a plot of z(t) vs t but on a different window. What is the error? O It is not possible to plot multiple plots O He is not using the line function Maybe he is using polar() instead of plot() O He is not using the hold functionarrow_forwardBrad is provided with a graph containing X branches. And it's given that the xth branch has a weight of Px. And for the given condition y-I + Py-Px there exits an edge connecting the branches. You have to develop a Python code that finds the number of connected components in this graph. Example Input: 1 3 152 Result: 1arrow_forwardUsing the recursion three method find the upper and lower bounds for the following recur- rence (if they are the same, find the tight bound). T(n) = T(n/2) + 2T(n/3) + n.arrow_forward
- d) For the graph below, list the nodes in an order that they might be marked as "done" when running Dijkstra's algorithm starting from node 2 (note that his is the same as the previous graph, but now with weights). 5 1 0 10 10 5.5 4 10 17 1 3 4 2 3 12arrow_forwardT/F 8. Without recursion, the Koch snowflake = 1 could be drawn.arrow_forwardJava:arrow_forward
- Are there any issues with using adjacency lists to depict a weighted graph?arrow_forward4tetarrow_forwardThe sphere below has a surface Area formula as SA and volume as V. Answer the following question. eter SA = 4a i. Plot a graph of SA vrs r for r=6 to 40 with a change in r as 0.2 ii. Plot a graph of SA vrs r for r=6 to 40 with a change in r as 0.2 iii. Write a c++ code to solve for i. iv. Write a c++ code to solve for ii.arrow_forward
arrow_back_ios
SEE MORE QUESTIONS
arrow_forward_ios
Recommended textbooks for you
- Computer Networking: A Top-Down Approach (7th Edi...Computer EngineeringISBN:9780133594140Author:James Kurose, Keith RossPublisher:PEARSON
 Computer Organization and Design MIPS Edition, Fi...Computer EngineeringISBN:9780124077263Author:David A. Patterson, John L. HennessyPublisher:Elsevier Science
 Network+ Guide to Networks (MindTap Course List)Computer EngineeringISBN:9781337569330Author:Jill West, Tamara Dean, Jean AndrewsPublisher:Cengage Learning
  Concepts of Database ManagementComputer EngineeringISBN:9781337093422Author:Joy L. Starks, Philip J. Pratt, Mary Z. LastPublisher:Cengage Learning
 Prelude to ProgrammingComputer EngineeringISBN:9780133750423Author:VENIT, StewartPublisher:Pearson Education
 Sc Business Data Communications and Networking, T...Computer EngineeringISBN:9781119368830Author:FITZGERALDPublisher:WILEY
Computer Networking: A Top-Down Approach (7th Edi...
Computer Engineering
ISBN:9780133594140
Author:James Kurose, Keith Ross
Publisher:PEARSON
Computer Organization and Design MIPS Edition, Fi...
Computer Engineering
ISBN:9780124077263
Author:David A. Patterson, John L. Hennessy
Publisher:Elsevier Science
Network+ Guide to Networks (MindTap Course List)
Computer Engineering
ISBN:9781337569330
Author:Jill West, Tamara Dean, Jean Andrews
Publisher:Cengage Learning
Concepts of Database Management
Computer Engineering
ISBN:9781337093422
Author:Joy L. Starks, Philip J. Pratt, Mary Z. Last
Publisher:Cengage Learning
Prelude to Programming
Computer Engineering
ISBN:9780133750423
Author:VENIT, Stewart
Publisher:Pearson Education
Sc Business Data Communications and Networking, T...
Computer Engineering
ISBN:9781119368830
Author:FITZGERALD
Publisher:WILEY