Plot the optimal values of pizza against its price for each question above on a graph. Describe the economic phenomenon that you observe with the plot. If you use Excel, you can put down your explanation in the Excel file. If you use Word/PDF, your graph can be penciled along with your explanation.
Plot the optimal values of pizza against its price for each question above on a graph. Describe the economic phenomenon that you observe with the plot. If you use Excel, you can put down your explanation in the Excel file. If you use Word/PDF, your graph can be penciled along with your explanation.

ChapterA: Working With Diagrams
Section: Chapter Questions
Problem 8QP

Related questions
Question
please help with #4
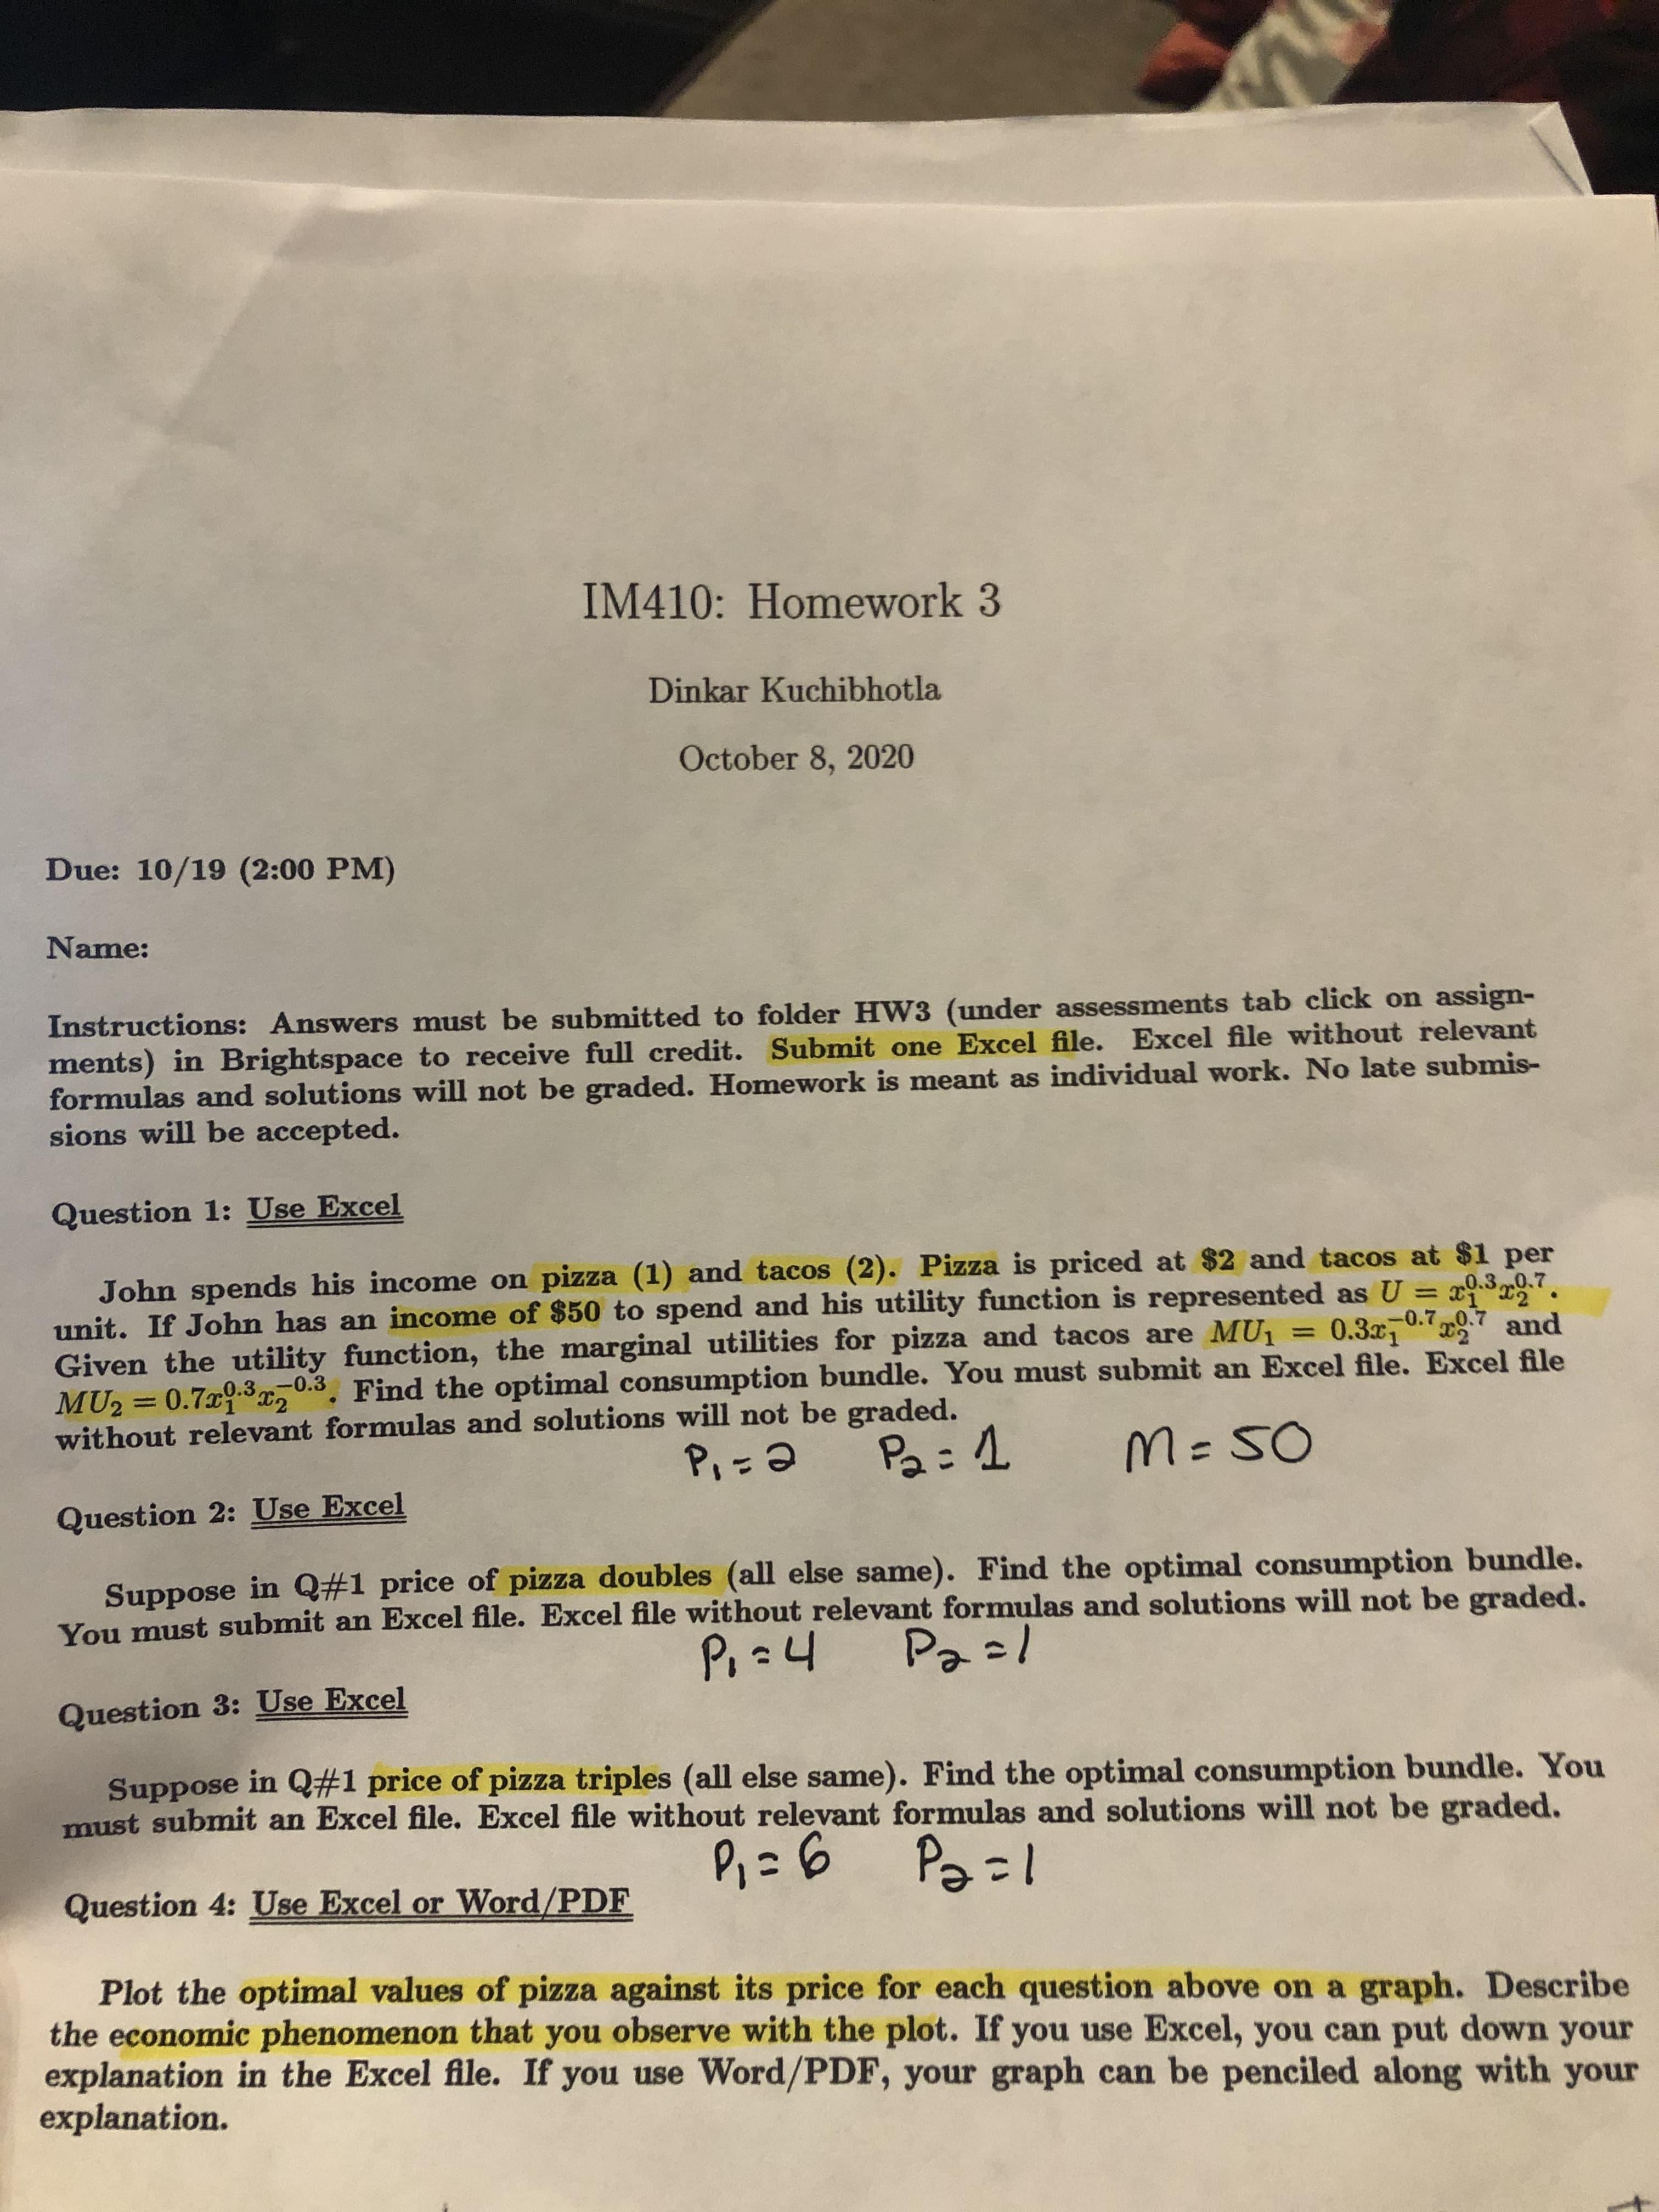
Transcribed Image Text:Plot the optimal values of pizza against its price for each question above on a graph. Describe
the economic phenomenon that you observe with the plot. If you use Excel, you can put down your
explanation in the Excel file. If you use Word/PDF, your graph can be penciled along with your
explanation.
Expert Solution
This question has been solved!
Explore an expertly crafted, step-by-step solution for a thorough understanding of key concepts.

Step by step
Solved in 4 steps with 1 images

Knowledge Booster


Learn more about
Need a deep-dive on the concept behind this application? Look no further. Learn more about this topic, economics and related others by exploring similar questions and additional content below.Recommended textbooks for you

Economics (MindTap Course List)
Economics
ISBN:
9781337617383
Author:
Roger A. Arnold
Publisher:
Cengage Learning

Economics (MindTap Course List)
Economics
ISBN:
9781337617383
Author:
Roger A. Arnold
Publisher:
Cengage Learning