Predicted Years of Receiving Social Secuity Benefits for Men Born in 1920 and 1940 and Change in Years of Benefit Receipt between the Two Birth Cohorts, by Rank in Mid-Career Income Distribution Predicted years of receiving Social Security: Men (in years) 30 25 20 15 8th Top Bom in 1940 Born in 1920 Bottom 2nd 3rd 4th 5th 6th 7th 9th Decile of mid-career income distribution Change in life expectancy at age 50: Women (in years) 8 6 4 2 6.4 4.8 4.0 3.4 2.9 2.3 1.8 7th 8th 9th Top Sth 6th 3rd 4th Bottom 2nd -2 Decile of mid-career income distribution
Predicted Years of Receiving Social Secuity Benefits for Men Born in 1920 and 1940 and Change in Years of Benefit Receipt between the Two Birth Cohorts, by Rank in Mid-Career Income Distribution Predicted years of receiving Social Security: Men (in years) 30 25 20 15 8th Top Bom in 1940 Born in 1920 Bottom 2nd 3rd 4th 5th 6th 7th 9th Decile of mid-career income distribution Change in life expectancy at age 50: Women (in years) 8 6 4 2 6.4 4.8 4.0 3.4 2.9 2.3 1.8 7th 8th 9th Top Sth 6th 3rd 4th Bottom 2nd -2 Decile of mid-career income distribution

Linear Algebra: A Modern Introduction
4th Edition
ISBN:9781285463247
Author:David Poole
Publisher:David Poole
Chapter4: Eigenvalues And Eigenvectors
Section4.6: Applications And The Perron-frobenius Theorem
Problem 25EQ

Related questions

Question
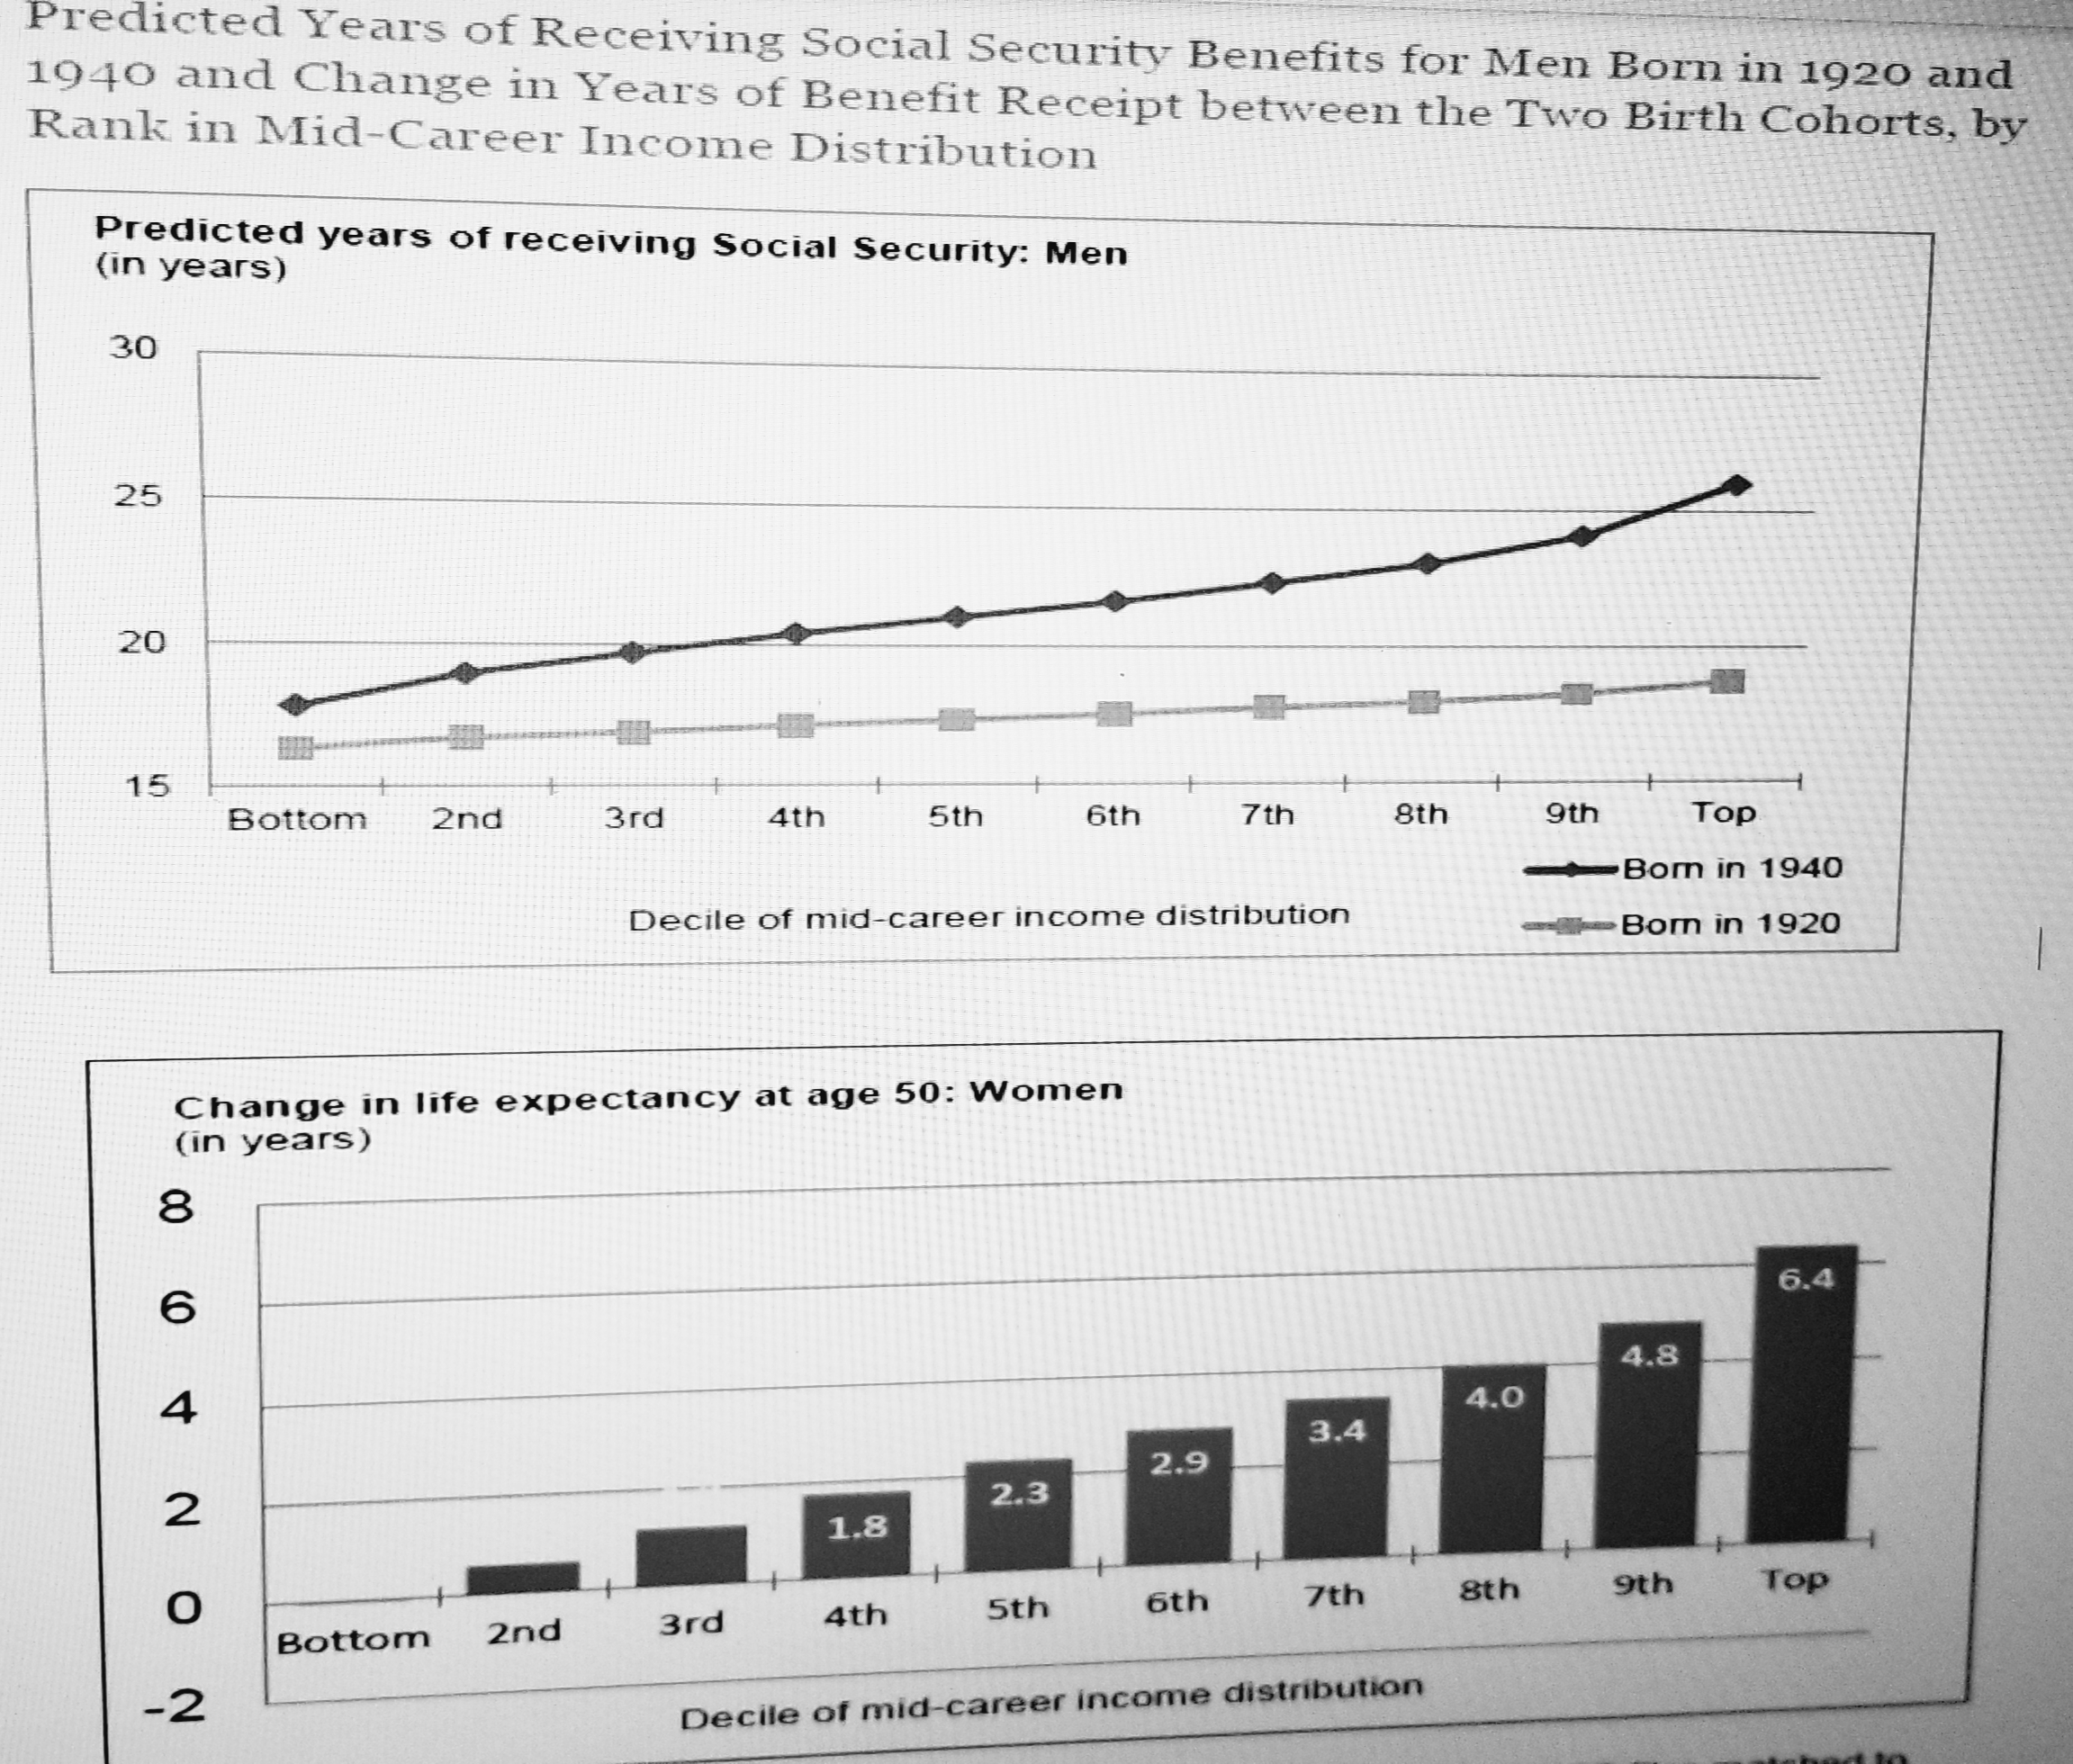
“Among those born in 1920, a woman in the lowest income group surviving to 50 could expect to live to age 80. A woman in the highest income group could expect to live to age 84. Use the chart below (and the 1st chart, above) to compute the percentage difference [(final–initial)/initial*100% or change/initial*100%] for Life Expectancy at age 50 for women born in 1920 and 1940 for the top and bottom deciles.
Transcribed Image Text:Predicted
Years
of
Receiving
Social Secuity Benefits for Men Born in 1920 and
1940 and Change in Years of Benefit Receipt between the Two Birth Cohorts, by
Rank in Mid-Career Income Distribution
Predicted years of receiving Social Security: Men
(in years)
30
25
20
15
8th
Top
Bom in 1940
Born in 1920
Bottom 2nd
3rd
4th
5th
6th
7th
9th
Decile of mid-career income distribution
Change in life expectancy at age 50: Women
(in years)
8
6
4
2
6.4
4.8
4.0
3.4
2.9
2.3
1.8
7th
8th
9th Top
Sth
6th
3rd
4th
Bottom 2nd
-2
Decile of mid-career income distribution
Expert Solution
This question has been solved!
Explore an expertly crafted, step-by-step solution for a thorough understanding of key concepts.

This is a popular solution!

Trending now
This is a popular solution!

Step by step
Solved in 3 steps with 3 images

Knowledge Booster


Learn more about
Need a deep-dive on the concept behind this application? Look no further. Learn more about this topic, statistics and related others by exploring similar questions and additional content below.Recommended textbooks for you
Linear Algebra: A Modern Introduction
Algebra
ISBN:
9781285463247
Author:
David Poole
Publisher:
Cengage Learning
Linear Algebra: A Modern Introduction
Algebra
ISBN:
9781285463247
Author:
David Poole
Publisher:
Cengage Learning