
Elements Of Electromagnetics
7th Edition
ISBN: 9780190698614
Author: Sadiku, Matthew N. O.
Publisher: Oxford University Press
expand_more
expand_more
format_list_bulleted
Related questions
Question
thumb_up100%
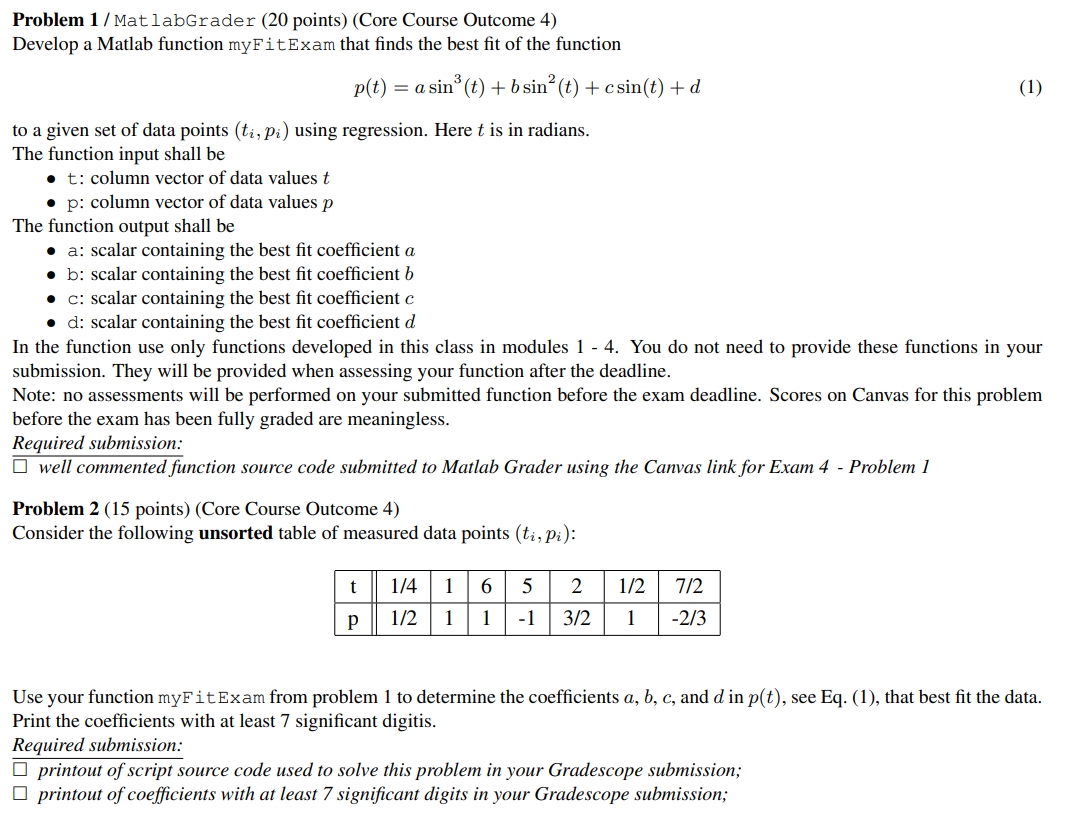

Transcribed Image Text:Problem 1/MatlabGrader (20 points) (Core Course Outcome 4)
Develop a Matlab function myFitExam that finds the best fit of the function
p(t) = as
sin³ (t) + b sin² (t) + csin(t) + d
(1)
to a given set of data points (ti, pi) using regression. Here t is in radians.
The function input shall be
⚫t: column vector of data values t
⚫ p: column vector of data values p
The function output shall be
• a: scalar containing the best fit coefficient a
b: scalar containing the best fit coefficient b
c: scalar containing the best fit coefficient c
d: scalar containing the best fit coefficient d
In the function use only functions developed in this class in modules 1 - 4. You do not need to provide these functions in your
submission. They will be provided when assessing your function after the deadline.
Note: no assessments will be performed on your submitted function before the exam deadline. Scores on Canvas for this problem
before the exam has been fully graded are meaningless.
Required submission:
☐ well commented function source code submitted to Matlab Grader using the Canvas link for Exam 4 - Problem 1
Problem 2 (15 points) (Core Course Outcome 4)
Consider the following unsorted table of measured data points (ti, pi):
t 1/4 1 6 5
2
1/2
7/2
р 1/2 1 1
-1
3/2 1
-2/3
Use your function myFit Exam from problem 1 to determine the coefficients a, b, c, and d in p(t), see Eq. (1), that best fit the data.
Print the coefficients with at least 7 significant digitis.
Required submission:
☐ printout of script source code used to solve this problem in your Gradescope submission;
printout of coefficients with at least 7 significant digits in your Gradescope submission;
Expert Solution
This question has been solved!
Explore an expertly crafted, step-by-step solution for a thorough understanding of key concepts.

Step by stepSolved in 2 steps

Knowledge Booster

Similar questions
- Problem 1/MatlabGrader (20 points) (Core Course Outcome 4) Develop a Matlab function myFit Exam that finds the best fit of the function p(t) = a sin³ (t) +bsin² (t) + csin(t) +d (1) to a given set of data points (t., p.) using regression. Here t is in radians. The function input shall be t: column vector of data values t p: column vector of data values p The function output shall be a: scalar containing the best fit coefficient a b: scalar containing the best fit coefficient b c: scalar containing the best fit coefficient c d: scalar containing the best fit coefficient d In the function use only functions developed in this class in modules 1 - 4. You do not need to provide these functions in your submission. They will be provided when assessing your function after the deadline. Note: no assessments will be performed on your submitted function before the exam deadline. Scores on Canvas for this problem before the exam has been fully graded are meaningless. Required submission: well…arrow_forwardDevelop a Matlab function myFitExam that finds the best fit of the function p(t) = a sin³ (t) +b sin² (t) + csin(t) + d (1) to a given set of data points (ti, pi) using regression. Here t is in radians. The function input shall be t: column vector of data values t ⚫ p: column vector of data values p The function output shall be • a: scalar containing the best fit coefficient a b: scalar containing the best fit coefficient b ⚫ c: scalar containing the best fit coefficient c d: scalar containing the best fit coefficient d In the function use only functions developed in this class in modules 1 - 4. You do not need to provide these functions in your submission. They will be provided when assessing your function after the deadline. Note: no assessments will be performed on your submitted function before the exam deadline. Scores on Canvas for this problem before the exam has been fully graded are meaningless.arrow_forwardI wanted to know how to create plots like these in MATLAB. I belive they were called herpolhode plots.arrow_forward
- In your biomechanical testing lab, you perform a series of compression tests to determine the relationship between apparent bone density (p, units of g/cm³) and ultimate stress (ơult, units of MPa). Using the set of experimental measurements below, write an m-file to fit a power relationship of the form O uli = Ap to the data. Use the log transform method to linearize the system and data, followed by linear regression. Plot the data points and the power relationship on a single plot. Be sure to label your axes and provide a legend. Provide a printout of your m-file and a printout of the command window showing your results. Write down the best fit equation and box it. 8.76 5.25 4.26 5.51 3.88 18.45 2.09 13.72 5.42 2.17 Oult (MPa) p (g/cm³) 0.598 | 0.459 0.319 | 0.235 0.141 0.754 0.177 0.553 0.394 0.246arrow_forwardSee 2 imagesarrow_forwardQ2: File Upload الزامي ABET äbäi 15 solve the question on a piece of [Q2] paper and upload it as ONE FILE here .{as an image or PDF only} Question 2 Use the least square regression to fit the data in the following table to the equation yfit = ae*. 1.5 2 y 1.6 3.7 7 13.5 24.6 1 2.5 (A) Determine the values of a and 3. (B) What is the standard error of this estimation? (C) Using the fit equation, what the value of y at r = 2.25? إضافة ملفarrow_forward
- In matlab codearrow_forwardProblem 3 Recitation The following table gives the approximate population of the US for selected years from 1835 to 1990 1835 1861 1905 1944 1990 30 year population (millions) 20 100 160 280 mx Assume that the population growth can be modeled with an exponential function p = be where x is the year and p is the population in millions. By hand, write the equation in linear form and use linear least squares regression to determine the constants b and m for which the function best fits the data. Use the function to estimate the population in the year 1960. Problem 3 required submission: Handwritten (or printed) answers.arrow_forwardFor all the following problems, 5. a) b) You need to show at least 3 iterations calculated manually with all steps. You do not need to include the M.files for the bisection method (bisect.m) and for false position (falspos.m). You must, however, show the command lines for the given functions with their variables and other parameters. Fanning friction factor For fluid flow in pipes, friction is described by a dimensionless number, the Fanning friction factor f. The Fanning friction factor is dependent on a number of parameters related to the size of the pipe and the fluid, which can all be represented by another dimensionless quantity, the Reynolds number Re. A formula that predicts ƒ given Re is the von Karman equation: 4log₁0 (Re√) - 0.4 = Typical values for the Reynolds number for turbulent flow are 10,000 to 500,000 and for the Fanning friction factor are 0.001 to 0.01. (a) Develop a function that uses bisection to solve for fgiven a user-supplied value of Re between 500 and…arrow_forward
- See both imagesarrow_forwardPlease Please use MATLAB with codes and graph. Recreate the following four Figures of the textbook using MATLAB and the appropriate parameters. Comment on your observations for each Figure. List all of the parameters that you have used. The figure is attached below.arrow_forwardI need help with a MATLAB code. I am trying to solve this question. Based on the Mars powered landing scenariosolve Eq. (14) via convex programming. Report the consumed fuel, and discuss the results with relevant plots. I am using the following MATLAB code and getting an error. I tried to fix the error and I get another one saying something about log and exp not being convex. Can you help fix my code and make sure it works. The error is CVX Warning: Models involving "log" or other functions in the log, exp, and entropy family are solved using an experimental successive approximation method. This method is slower and less reliable than the method CVX employs for other models. Please see the section of the user's guide entitled The successive approximation method for more details about the approach, and for instructions on how to suppress this warning message in the future.Error using .* (line 173)Disciplined convex programming error: Cannot perform the operation:…arrow_forward
arrow_back_ios
SEE MORE QUESTIONS
arrow_forward_ios
Recommended textbooks for you
- Elements Of ElectromagneticsMechanical EngineeringISBN:9780190698614Author:Sadiku, Matthew N. O.Publisher:Oxford University Press
 Mechanics of Materials (10th Edition)Mechanical EngineeringISBN:9780134319650Author:Russell C. HibbelerPublisher:PEARSON
 Thermodynamics: An Engineering ApproachMechanical EngineeringISBN:9781259822674Author:Yunus A. Cengel Dr., Michael A. BolesPublisher:McGraw-Hill Education
  Control Systems EngineeringMechanical EngineeringISBN:9781118170519Author:Norman S. NisePublisher:WILEY
 Mechanics of Materials (MindTap Course List)Mechanical EngineeringISBN:9781337093347Author:Barry J. Goodno, James M. GerePublisher:Cengage Learning
 Engineering Mechanics: StaticsMechanical EngineeringISBN:9781118807330Author:James L. Meriam, L. G. Kraige, J. N. BoltonPublisher:WILEY
Elements Of Electromagnetics
Mechanical Engineering
ISBN:9780190698614
Author:Sadiku, Matthew N. O.
Publisher:Oxford University Press
Mechanics of Materials (10th Edition)
Mechanical Engineering
ISBN:9780134319650
Author:Russell C. Hibbeler
Publisher:PEARSON
Thermodynamics: An Engineering Approach
Mechanical Engineering
ISBN:9781259822674
Author:Yunus A. Cengel Dr., Michael A. Boles
Publisher:McGraw-Hill Education
Control Systems Engineering
Mechanical Engineering
ISBN:9781118170519
Author:Norman S. Nise
Publisher:WILEY
Mechanics of Materials (MindTap Course List)
Mechanical Engineering
ISBN:9781337093347
Author:Barry J. Goodno, James M. Gere
Publisher:Cengage Learning
Engineering Mechanics: Statics
Mechanical Engineering
ISBN:9781118807330
Author:James L. Meriam, L. G. Kraige, J. N. Bolton
Publisher:WILEY