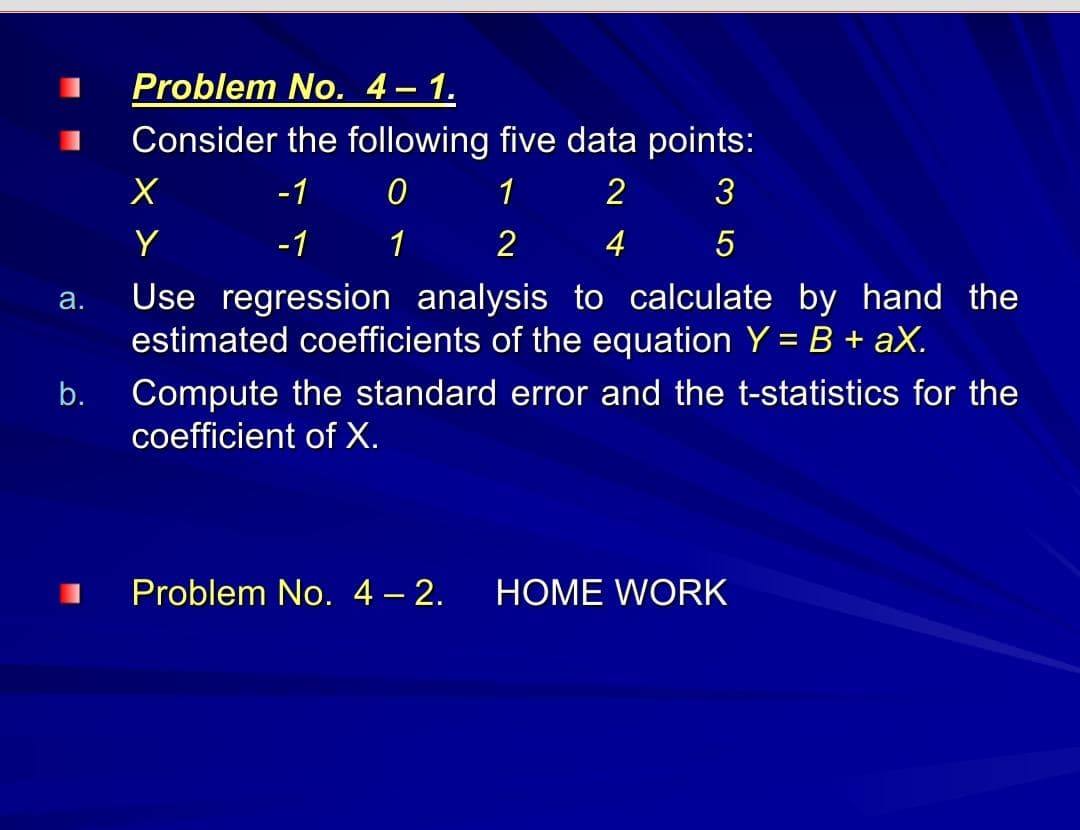
Problem No. 4–1. Consider the following five data points: -1 1 2 -1 1 2 4 Use regression analysis to calculate by hand the estimated coefficients of the equation Y = B + aX. Compute the standard error and the t-statistics for the coefficient of X.


Q: QUESTION 19 The following information represents chlorine residuals in swimming pool (y) and the…
A: Ans : Option A - 0.016
Q: The data in Table 11.17 are given for 9 patients with aplastic anemia [11]. 11.1 Fit a regression…
A: Hii ! Thanks for posting the question . Since your question has more than three subparts , we have…
Q: QUESTION 19 Consider the following dataset: y. х1 x2 34 1 55 33 72 4 Is it possible to run a…
A: Correct option is True
Q: 1. Consider the regression model: M] = ßo = ß1 × UR where MJ is the past-month marijuana-use rate…
A: The regression equation is MJ^=8.971+0.244UR, MJ is the past-month marijuana-use rate for 12-17…
Q: Chapter 13, Section 13.1, Problem 02öbe An auto manufacturing company wanted to investigate how the…
A: Definition: Regression Analysis Regression analysis is used measure the association between two are…
Q: Question 2 For the data given in the table below, estimate the linear regression line. Comment rº of…
A: Regression: The regression analysis is conducted here by using EXCEL. The software procedure is…
Q: Suppose we know the following information about a set of bivariate data: Var(x)=Var(x)=2.46…
A: Obtain the value of the intercept of the linear least-squares regression. The value of the…
Q: Problem1- Given the following data taken from an experiment (V: voltages, t: time). 2 6 9 12 19 t 4…
A: Hello! As you have posted more than 3 sub parts, we are answering the first 3 sub-parts. In case…
Q: This problem is based on problems 18.1, 18.2, 18.9, & 18.10 from Lomax & Hahs-Vaughn, 3rd ed. You…
A: Since you have asked multiple sub parts of the question, we will solve first three sub parts for…
Q: Problem 3 A teacher measured the hours of study of seven students in one week and compared the…
A:
Q: Problem 7. deposition appeared in a recent study. The accompanying data on x = current density…
A: Hi! Thank you for the question, As per the honor code, we are allowed to answer three sub-parts at a…
Q: Which of the following is a false statement? A) Since univariate models typically leave out lots…
A: All the given statement shown below are correct
Q: Question 12: Here is a bivariate data set. Find the regression equation for the response variable y.…
A: Solution Given data is
Q: Problem 6
A: In a multiple linear regression model, an explanatory variable is said to be most important if it…
Q: QUESTION 17 Table of correlation coeffients Gross Gross Attendance Playing weeks New Productions…
A: Coefficient of variation is an important statistic is regression analysis.
Q: Although the Excel regression output, shown in Figure 12.21 for Demonstration Problem 12.1, is…
A: Given information: The result of simple linear regression is given.
Q: Problem 1: I have uploaded data (PCE-PDI.xls) for the US total personal consumption expenditures and…
A: (a) Estimate a two-variable regression model for both subsamples and report the estimated results.…
Q: ) In estimating the regression in problem #2, you are also concerned that the t-statistics may be…
A: we need to conduct a regression of the squared residuals against the dummy variables X1, X2, and X3…
Q: Problem 1. Perform a least squares linear regression on the dataset {(-1,–1), (0, 7), (1, 1)}, where…
A:
Q: Question 5 - what is the y-intercept of the equation of the regression line y = 36.11695 + 7.20508x…
A: Option b) is correct. The intercept is 36.11695
Q: QUESTION 15 If the least-squares regression line is y = 5 x-3, then for x = 3, the predicted value…
A:
Q: 6) Consider the following problem. Student Test Score IQ Gender 1 93 125 Male 2 86 120 Female 3 96…
A: Given: y x1 x2 93 125 Male 86 120 Female 96 115 Male 81 110 Female 92 105 Male 75…
Q: i.i.d. that e; " Problem 4 Consider the simple linear regression model Y = Bo+B1X+e. Assume N (0,…
A:
Q: 1. Consider the regression model: M] = ßo = ß1 × UR where MJ is the past-month marijuana-use rate…
A: There are total 51 observations so the degree of freedom will be n-2. df=n-2=51-2=49 Using the…
Q: Statistics students in Oxnard College sampled 10 textbooks in the Condor bookstore and recorded the…
A: The independent variable is Number of pages (x). The dependent variable is Cost (y). We have to find…
Q: Question 34 Suppose that the true population regression model is y = Bo + B₁ * x₁ + B₂ * x₂ + U. 3₁…
A: Disclaimer: Since you have asked multiple questions, we will solve the first question for you. If…
Q: Question 1 ( The height of the father (y) is linearly related to the height of their sons (x). In a…
A:
Q: Problem # 3. A random sample of 8 office staffs hired within the last year was selected from a large…
A: The question is based on regression analysis. Given data :
Q: You are given the following data, where X1 (years of working experience at current position) and X2…
A: Hello! As you have posted more than 3 sub parts, we are answering the first 3 sub-parts. In case…
Q: Question 4 The following table displays the mathematics test scores for a random sample of college…
A: From the data: x y x2 xy 39 65 1521 2535 43 78 1849 3354 21 52 441 1092 64 82 4096 5248…
Q: Given that the equation for the regression line is ŷ 0.00683x – 0.03024, what is the residual for…
A: The brain activity for subject 9 is 0.153.
Q: Question 5 The following are midterm and final examination test scores for 10 students from a…
A:
Q: Question 2 8.14. From a sample of 209 firms, Wooldridge obtained the following regres- sion…
A: “Since you have posted a question with multiple sub-parts, we will solve the first three subparts…
Q: Problem 1: It is of interest to study the effect of population size in millions (x) in various…
A: From given data, X Y X*Y X*X Y*Y 126 0.6 75.6 15876 0.36 135 4.9 661.5 18225 24.01 124 0.2…
Q: 8. Consider again the data describing the relationship between weight and blood pressure described…
A:
Q: Question 21: Annual high temperatures in a certain location have been tracked for several years. Let…
A: By using online calculator Y ^ = 11.5+0.04x
Q: Question 8 An article in Technometrics by S. C. Narula and J. F. Wellington ["Prediction, Linear…
A: Since you have posted a question with multiple sub-parts, we will solve first three sub- parts for…
Q: QUESTION THREE The price of a deep freezer and size of the deep freezer at Mongu Habour in Western…
A:
Q: In questions 6 & 7, use the following printout of the linear regression relating the moving times…
A: 6 From the output, The standard error for the variable Weight is 0.002977. That is, Sb1=0.002977…
Q: Problem1- Given the following data taken from an experiment (V: voltages, t: time). 2 4 6 11 12 15…
A: The data from an experiment for which the voltage (V) and time (t) is provided. Minitab is used in…
Q: QUESTION 10 The following information represents chlorine residuals in swimrning pool (y) and the…
A:
Q: 1. Using the data points on the given scatter diagram, determine the equation of the regression line…
A: Linear regression is used to find the relationship between two continuous variables.
Q: QUESTION 7 A researcher has estimated a linear model to study the effect of weekly household income…
A: Slope is the measure of regression equation. It is the changing variable in the regression equation.…
Q: The data resulting from a random sample of 5 observations are shown below. Y is the dependent…
A: Since we only answer up to 3 sub-parts, we’ll answer the first 3. Please resubmit the question and…
Q: Problem 4 Given the data (1 2 2 15 0 X = |1 3 5 10 1 (1 0 -2 and the least square estimates of a…
A: When we want to estimate an impact of many variables on the one variable at that time we…
Q: Question 4 The following table shows information related to the number of salesman and sales made…
A: As per our guidelines , we are allowed to answer first question only. First 2 sub-parts belong to…

Step by step
Solved in 2 steps

- The following fictitious table shows kryptonite price, in dollar per gram, t years after 2006. t= Years since 2006 0 1 2 3 4 5 6 7 8 9 10 K= Price 56 51 50 55 58 52 45 43 44 48 51 Make a quartic model of these data. Round the regression parameters to two decimal places.Olympic Pole Vault The graph in Figure 7 indicates that in recent years the winning Olympic men’s pole vault height has fallen below the value predicted by the regression line in Example 2. This might have occurred because when the pole vault was a new event there was much room for improvement in vaulters’ performances, whereas now even the best training can produce only incremental advances. Let’s see whether concentrating on more recent results gives a better predictor of future records. (a) Use the data in Table 2 (page 176) to complete the table of winning pole vault heights shown in the margin. (Note that we are using x=0 to correspond to the year 1972, where this restricted data set begins.) (b) Find the regression line for the data in part ‚(a). (c) Plot the data and the regression line on the same axes. Does the regression line seem to provide a good model for the data? (d) What does the regression line predict as the winning pole vault height for the 2012 Olympics? Compare this predicted value to the actual 2012 winning height of 5.97 m, as described on page 177. Has this new regression line provided a better prediction than the line in Example 2?Although the Excel regression output, shown in Figure 12.21 for Demonstration Problem 12.1, is somewhat different from the Minitab output, the same essential regression features are present. The regression equation is found under Coefficients at the bottom of ANOVA. The slope or coefficient of x is 2.2315 and the y-intercept is 30.9125. The standard error of the estimate for the hospital problem is given as the fourth statistic under Regression Statistics at the top of the output, Standard Error = 15.6491. The r2 value is given as 0.886 on the second line. The t test for the slope is found under t Stat near the bottom of the ANOVA section on the “Number of Beds” (x variable) row, t = 8.83. Adjacent to the t Stat is the p-value, which is the probability of the t statistic occurring by chance if the null hypothesis is true. For this slope, the probability shown is 0.000005. The ANOVA table is in the middle of the output with the F value having the same probability as the t statistic,…
- Question 2: The estimated regression equation for a model involving two independent variables and 65 observations is: yhat = 55.17+1.1X1 -0.153X2 Other statistics produced for analysis include: SSR = 12370.8, SST = 35963.0, Sb1 = 0.33, Sb2 = 0.20.a. Interpret b1 and b2 in this estimated regression equation b. Predict y when X1 = 65 and X2 = 70. c. Compute R-square and Adjusted R-Square. d. Comment on the goodness of fit of the model. e. Compute MSR and MSE. f. Compute F and use it to test whether the overall model is significant using a p-value (α = 0.05). g. Perform a t test using the critical value approach for the significance of β1.Use a level of significance of 0.05. h. Perform a t test using the critical value approach for the significance of β2.Use a level of significance of 0.05.The operations manager of a musical instrument distributor feels that the demand for Bass Drums may be related to the number of television appearances by the popular rick group Green Shades during the previous month. The manager has collected the data shown in the following table. Demand for Bass Drums 3 6 7 5 10 8 Green Shades TV appearances 3 4 7 6 8 5 Develop the linear regression equation to forecast. Forecast demand for Bass Drums when Green Shades’ TV appearances are 10. Compute MSE and standard deviation for Problem 8.The following table shows the annual number of PhD graduates in a country in various fields. NaturalSciences Engineering SocialSciences Education 1990 70 10 60 30 1995 130 40 120 50 2000 330 130 280 140 2005 490 370 460 210 2010 590 550 830 520 2012 690 590 1,000 900 (a) With x = the number of social science doctorates and y = the number of education doctorates, use technology to obtain the regression equation. (Round coefficients to three significant digits.) y(x) = Graph the associated points and regression line. (b) What does the slope tell you about the relationship between the number of social science doctorates and the number of education doctorates? The slope tells us the increase in the number of education doctorates for each additional social science doctorate.The slope tells us the decrease in the number of education doctorates for each additional social science doctorate. The slope tells us the increase in the number…
- The following table shows the annual number of PhD graduates in a country in various fields. NaturalSciences Engineering SocialSciences Education 1990 70 10 70 30 1995 130 40 110 50 2000 330 130 280 140 2005 490 370 460 210 2010 590 550 830 520 2012 690 590 1,000 900 (a) With x = the number of social science doctorates and y = the number of education doctorates, use technology to obtain the regression equation. (Round coefficients to three significant digits.) y(x) = Graph the associated points and regression line. (b) What does the slope tell you about the relationship between the number of social science doctorates and the number of education doctorates? The slope tells us the increase in the number of social science doctorates for each additional education doctorate.The slope tells us the increase in the number of education doctorates for each additional social science doctorate. The slope tells us the decrease in the number…he following table shows the annual number of PhD graduates in a country in various fields. NaturalSciences Engineering SocialSciences Education 1990 70 10 60 30 1995 130 40 100 50 2000 330 130 280 140 2005 490 370 460 210 2010 590 550 830 520 2012 690 590 1,000 900 (a)With x = the number of social science doctorates and y = the number of education doctorates, use technology to obtain the regression equation. (Round coefficients to three significant digits.) y(x) = Use technology to obtain the coefficient of correlation r. (Round your answer to three decimal places.) r =The following table shows the annual number of PhD graduates in a country in various fields. NaturalSciences Engineering SocialSciences Education 1990 70 10 70 30 1995 130 40 110 40 2000 330 130 280 120 2005 490 370 460 210 2010 590 550 830 520 2012 690 590 1,000 900 (a) With x = the number of social science doctorates and y = the number of education doctorates, use technology to obtain the regression equation. (Round coefficients to three significant digits.) y(x) = (b) Use technology to obtain the coefficient of correlation r. (Round your answer to three decimal places.) r =
- The following table shows the annual number of PhD graduates in a country in various fields. NaturalSciences Engineering SocialSciences Education 1990 70 10 60 30 1995 130 40 100 50 2000 330 130 280 140 2005 490 370 460 210 2010 590 550 830 520 2012 690 590 1,000 900 (a) With x = the number of social science doctorates and y = the number of education doctorates, use technology to obtain the regression equation. (Round coefficients to three significant digits.) y(x) =Consider the following regression equation specied for 2-period panel data: where i = 1; 2; :::N and t = 1; 2. If you expect that β_1 is positive, but the correlation between Δx_i and Δu_i is negative, thenwhat is the bias in the OLS estimator of β_1 in the first-differenced equation?The following table shows the annual number of PhD graduates in a country in various fields. NaturalSciences Engineering SocialSciences Education 1990 70 10 60 30 1995 130 40 120 40 2000 330 130 280 120 2005 490 370 460 210 2010 590 550 830 520 2012 690 590 1,000 900 (a)With x = the number of social science doctorates and y = the number of education doctorates, use technology to obtain the regression equation. (Round coefficients to three significant digits.) y(x) =
