
Practical Management Science
6th Edition
ISBN: 9781337406659
Author: WINSTON, Wayne L.
Publisher: Cengage,
expand_more
expand_more
format_list_bulleted
Related questions
Question

Transcribed Image Text:Proctoring Enabled: Chapter 12 Computer Simulation: Bas... A
Saved
Help
Save & Exit
Submit
4
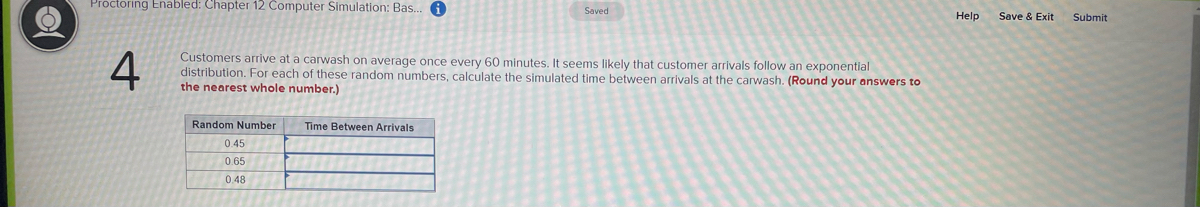
Customers arrive at a carwash on average once every 60 minutes. It seems likely that customer arrivals follow an exponential
distribution. For each of these random numbers, calculate the simulated time between arrivals at the carwash. (Round your answers to
the nearest whole number.)
Random Number
Time Between Arrivals
0.45
0.65
0.48
Expert Solution
This question has been solved!
Explore an expertly crafted, step-by-step solution for a thorough understanding of key concepts.

This is a popular solution

Trending nowThis is a popular solution!

Step by stepSolved in 2 steps

Knowledge Booster

Similar questions
- n Canada, many people have complained that the waiting time in hospital emergency is oftenvery long. (Here, the waiting time is defined as the time from arrival to departure.)A typical service process in a hospital emergency has several stages:1. When patients arrive, they register personal information (such as health card number,reasons to be there) in a computer. Then, patients wait in an open waiting area.2. There is often one or two doctors whose offices are at the side of the open waiting area.The doctor(s) talks with the patients one by one to have preliminary diagnosis andprovide some help.3. Then, the patients wait in the same waiting area.4. A nurse arranges (part of) the patients to a closed area to wait for doctors.5. A nurse arranges the patients waiting in the closed area to individual rooms to wait fordoctors.6. A doctor helps the patients individually. Then, patients leave individually.According to your simulation, what is the bottleneck of reducing the waiting time?…arrow_forwardDEMU 2103, va assignmen QUESTION 3 Metropolitan General Hospital is a city-owned and operated public hospital. Its emergency. room is the largest and most prominent in the city. Approximately 70% of emergency cases in the city come or are sent to Metro General's emergency room. As a result, the emergency room is often crowded and the staff is overworked, causing concern among hospital administrators and city officials about the quality of service and health care the emergency room is able to provide. One of the key quality attributes administrators focus on is patient waiting time that is, the time between when a patient checks in and registers and when the patient first sees an appropriate medical staff member. Hospital administration wants to monitor patient waiting time using statistical process control charts. At different times of the day over a period of several days, patient waiting times were recorded at random with the following results: Sample 1 2 3 4 5 6 7 8 9 10 1 27 22 16…arrow_forwardTaylor Swiftt works at a call center as an analyst. In her role, she is tasked with data administration and finding patterns in the data generated from all of the customer service interactions that take place. She has been asked to create a visualization of this data so that she can see at what time most service calls come in during the week. What would you recommend that Taylor develop so that her supervisor can see when calls are coming in, live? Choose the best answer from the options available. Group of answer choices A daily report An interactive dashboard A crystal ball A narrativearrow_forward
- Only need (H) answered.arrow_forwardPlease do not give solution in image format thanku 1. A single server queuing system with a Poisson arrival rate and exponential service time has an average arrival rate of 13 customers per hour and an average service rate of 20 customers per hour. The average length of time customers will spend in the system is: Select one: a. 0.09286 minutes b. 0.1429 minutes c. 8.571 minutes d. 5.571 minutes 2. A single server queuing system with a Poisson arrival rate and exponential service time has an average arrival rate of 10 customers per hour and an average service rate of 13 customers per hour. The probability of 3 customers in the system is : Select one: a.0.895 b.0.5448 c.0.2308 d.0.105arrow_forward
arrow_back_ios
arrow_forward_ios
Recommended textbooks for you
- Practical Management ScienceOperations ManagementISBN:9781337406659Author:WINSTON, Wayne L.Publisher:Cengage,
 Operations ManagementOperations ManagementISBN:9781259667473Author:William J StevensonPublisher:McGraw-Hill Education
 Operations and Supply Chain Management (Mcgraw-hi...Operations ManagementISBN:9781259666100Author:F. Robert Jacobs, Richard B ChasePublisher:McGraw-Hill Education
 Purchasing and Supply Chain ManagementOperations ManagementISBN:9781285869681Author:Robert M. Monczka, Robert B. Handfield, Larry C. Giunipero, James L. PattersonPublisher:Cengage Learning
 Production and Operations Analysis, Seventh Editi...Operations ManagementISBN:9781478623069Author:Steven Nahmias, Tava Lennon OlsenPublisher:Waveland Press, Inc.
Practical Management Science
Operations Management
ISBN:9781337406659
Author:WINSTON, Wayne L.
Publisher:Cengage,
Operations Management
Operations Management
ISBN:9781259667473
Author:William J Stevenson
Publisher:McGraw-Hill Education
Operations and Supply Chain Management (Mcgraw-hi...
Operations Management
ISBN:9781259666100
Author:F. Robert Jacobs, Richard B Chase
Publisher:McGraw-Hill Education
Purchasing and Supply Chain Management
Operations Management
ISBN:9781285869681
Author:Robert M. Monczka, Robert B. Handfield, Larry C. Giunipero, James L. Patterson
Publisher:Cengage Learning
Production and Operations Analysis, Seventh Editi...
Operations Management
ISBN:9781478623069
Author:Steven Nahmias, Tava Lennon Olsen
Publisher:Waveland Press, Inc.