Related questions
Question
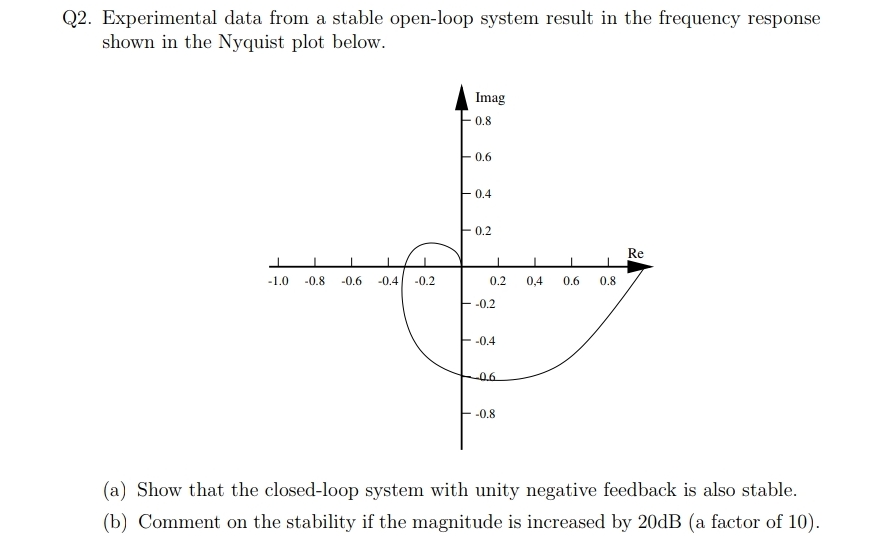

Transcribed Image Text:Q2. Experimental data from a stable open-loop system result in the frequency response
shown in the Nyquist plot below.
Imag
0.8
F0.6
0.4
0.2
Re
-1.0
-0.8
-0.6
-0.4 -0.2
0.2
0,4
0.6
0.8
-0.2
E-0.4
-0.6
-0.8
(a) Show that the closed-loop system with unity negative feedback is also stable.
(b) Comment on the stability if the magnitude is increased by 20DB (a factor of 10).
Expert Solution
This question has been solved!
Explore an expertly crafted, step-by-step solution for a thorough understanding of key concepts.

Step by stepSolved in 2 steps with 2 images

Knowledge Booster

Similar questions
- The figure shows three wires with equal currents and four Amperian loops (dashed closed paths). Rank the loops in increasing magnitude (absolute value) of OB•di . A. 3<1=4<2 B. 1<2=3<4 C. 3<2<1=4 D. 4<1<2< 3 E. 4<2= 3<1arrow_forward2. What is the capacitive reactance of a 0.10 µF capacitor at a 100HZ audio frequency and at a 100MHZ FM-radio frequency?arrow_forward4. The following data are obtained for a Cu-Ni-Fe alloy during the generation of a steady-state ferromagnetic hysteresis loop. a. Plot the data b. What is the remanent induction? c. What is the coercive field? H (amperes/m) B (weber/m?) 0.65 (saturation point) 6 x 10⁴ 1 x 10⁴ 0.58 0.56 - 1 x 10⁴ - 2 x 10⁴ - 3 x 10⁴ - 4 x 10⁴ - 5 x 10⁴ 0.53 0.46 0.30 - 0.44 6 x 10⁴ - 0.65arrow_forward
- thanks!arrow_forwardAn alternating current is set up in an LRC circuit. For which of the following circuit elements are the current and voltage in phase? O A. inductor only O B. inductor, resistor, and capacitor OC. capacitor only D. resistor onlyarrow_forward8. We desire to make an LC circuit that oscillates at an angular frequency of 200 rad/sec using a 2.5 H inductor. What is the value of the capacitor that should be used? A. 1F B. 2 µF C. 10 µF D. 22 µF E. 102 µFarrow_forward
arrow_back_ios
arrow_forward_ios