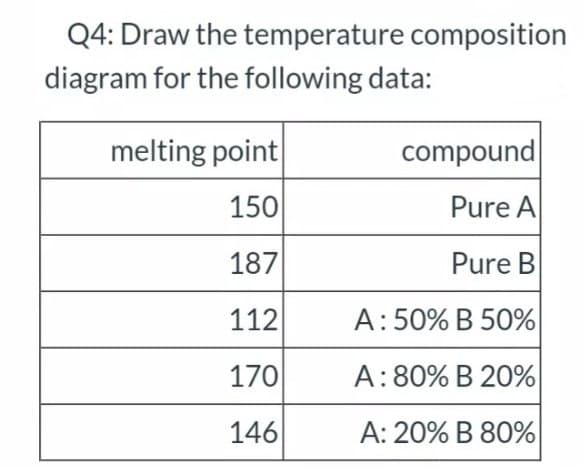
Q4: Draw the temperature composition diagram for the following data: melting point compound 150 Pure A 187 Pure B 112 A:50% B 50% 170 A: 80% B 20% 146 A: 20% B 80%


Q: Homogenous mixture Solution Pure Substance Physical Methods of Separation a) b) c)
A: A homogenous mixture is a type of mixture in which the composition is uniform and every part of…
Q: Incorrect Separation Scheme NH2 ether, 10 % NaOH ether aq NH 6 M HC1 Na,SO,. gravity filtration…
A: We are given a nonpolar organic compound, naphthalene, and an alkyl amine to separate.
Q: In each scenario, describe a step by step process in determining the unknown. Distilled water maybe…
A: A question based on properties of liquids and solids that is to be accomplished.
Q: My Question) Why this calculation is wrong? I think this calculation is same with question 1. Isn't…
A: The question is based on the concept of quantitative analysis. we have to calculate how much calcium…
Q: 8) NH2 ether, 10 % NaOH Step 1 ether NH 6 M HCI Na,SO.. gravity filtration vacuum filtration aq…
A:
Q: 14 12 10 - 8 4 2 10 20 30 40 50 Volume of acid added (mL) Hd
A: The titration curve given is,
Q: Jse only dimensional analysis to solve this problem. Include a number, unit, and substance in the…
A: Given that: Mass of methanol = 60.0 g Density of methanol = 0.791 g/mL Percent of solution =…
Q: In a fractional distillation of a cyclohexane/toluene mixture the effectiveness of the distillation…
A: The solution is given below -
Q: nitroglycerin contain the following amounts of drug 1/25gr, 1/10gr and 1/50gr. Express these…
A: As we know, conservation, 1 gr = 1000 milligrams A) 1/25 gr = 1×1000/25 = 40 milligrams B)…
Q: pleasee convert this with solution 759g-cg 466.75qt-mL 610.76min-ms
A: •Here we have to convert one given unit to another. • Here:- g= grams cg=centigram…
Q: In what order should the following methods be used to separate a mixture containing…
A: We have given a mixture of four components 1. Sugar 2. Ethanol 3. Water 4. Sand Based on their…
Q: To enter exponential values, use the format 1.0e-5. Solution 1.10 M Acetic acid (mL)| 0.900 M Sodium…
A:
Q: Organic liquids are usually less dense than water. True False
A:
Q: How many mL of a 0.250 M KCI solution must be diluted to 1.000 L so that the diluted solution…
A: Concentration of KCl stock solution = 0.250 M 1 M KCl contains 1M of K+. So, Concentration of K+…
Q: 1-propanol, 2-propanol, and 1-butanol all have boiling too close together to be separated using…
A: Compounds with large difference in boiling point can be easily separated by simple distillation…
Q: Prepare the following solutions: 100.0 mL 0.0500 M stock Ca2+ solution 50.0 mL 0.0050 M working…
A: Given data, Concentration of stock solution = 0.0500M Concentration of desired solution = 0.0050M…
Q: pure liqu PB liquid x solution B Esure solid x liquid x (saturate»
A: Phase diagram is a graphical representation of the physical states of a substance under different…
Q: Determine ΔT (T1 – T2), where T1 is the melting point of pure lauric acid and T2 is the melting…
A: We need to calculate the temperature difference for the solution of lauric acid and Benzoic acid…
Q: The solubility of PbCO3 in water at 25°C is measured to be 7.3x10⁻⁵g/L. Use this information to…
A: Complete solution in attached file
Q: Assess the following statements about fractional distillation. Determine which are TRUE/FALSE…
A: 1. If the samples are of close boiling point we can seperate by using fractional distillation and ni…
Q: Draw a bar diagram on your sketch paper based on the table below and determine the non-carbon…
A: Hardness is defined as the soap consuming capacity of water. Temporary hardness is caused due to…
Q: Explain in detail how you would make the solution from the previous question (50.00 mL a 300 ug/dL…
A: We have to prepare 50.00 mL of a 300 μg/dL solution from a 1500 μg/dL stock solution. So, here the…
Q: What is the answer to the following calculation, to the correct number of sig figs?…
A: What is the answer to the following calculation, to the correct number of sig figs?
Q: Some crushed ice was placed in a 400 mL beaker. Some of the ice was allowed to melt before the…
A: Given data :-
Q: Why is fractional distillation more efficient than simple distillation when purifying liquid…
A: Fractional distillation is used to separate a mixture of liquids with similar boiling points…
Q: Aromatic Elixir Formula Compound orange spirit Syrup Talc 90% Ethanol Purified water To make 50ml ||
A: Complete process of aromatic elixir is given below.
Q: Q: assume citrix acid makes up 7.96% by volume of the lime juice . How many moles of citrix acid…
A:
Q: Calculate the volume of concentrated (98% v.v) H2SO4 that you will need to prepare 250ml of an 5.4 M…
A: Given: Concentrated solution is 98% v/v Volume of diluted solution = 250 ml Molarity of diluted…
Q: Group 7. must he add to the 150 mL mixture to get a 20% ethanol mixture? Bernard has a 150 mL of 5%…
A: Given data we have 150 mL of solution : V1=150 mLwhich contain 5 % ethanol : C1=5%and water…
Q: 18. How would you best separate a mixture of volatile gases propane, butane, and Isopi C. Magnetic…
A:
Q: From the graph of temperature vs. volume data from a fractional distillation of 100 mL…
A: Fractional distillation It is the separation technique used for miscible liquids. It involves the…
Q: From the graph of temperature vs. volume data from a fractional distillation of 100 mL…
A: Methanol and water fractional distillation is an analytical process used to separate compounds such…
Q: Which of the following liquid mixtures can be best separated using simple distillation? A. Dimethyl…
A: The separation process by which two different solutions having different boiling points is separated…
Q: Draw a bar diagram on your sketch paper based on the table below and determine the non-carbon…
A:
Q: 18 g of unknown organic sample was dissolve in 758 mL of Dicloromethane (DCM). The boiling point of…
A:
Q: Simple Distillation The temperature was 76o C when the first drop of distillate was collected.…
A: Distillation is a method to separate miscible liquids at different temperatures.
Q: Q2: Use any of the following chemicals and equipment's and designs a suitable experimental procedure…
A: Detailed procedure and extraction technique in the below notes. 1) Oxidation of cyclohexanol to form…
Q: After the ethyl acetate is evaporated, Q and R (a mixture of liquids) remain. A) What criteria does…
A: Distillation is a process to separate two mixtures with different boiling points by applying heat.…
Q: 17 g of unknown organic sample was dissolve in 564 mL of Dicloromethane (DCM). The boiling point of…
A: NOTE: It will be benzene only and not DCM as the data is given for benzene and there is a typo error…
Q: What are the functions of the graduated cylinder and distillate in a distillation set-up?
A: In the process of distillation, generally we separate the liquid from non volatile solid heating at…
Q: Post Lab Questions 1 A student performed a freezing point determination for a solution with the…
A: Since you have posted more than one question , we are doing first one for you. To do the rest repost…
Q: 5mL 10% NaoH solution theo mmol diper theo mass divemakcetone mASs recovered mmol alacetorie mmol eg…
A: The questions are based on the concepts of experimental Chemistry. We have to calculate mass, moles…
Q: A rubbing alcohol sample composed of 60% isopropyl alcohol and water was distilled using a simple…
A: The process of distillation is is inspired by nature. In this process, liquid is heated to form a…
Q: A student measured the melting point range of an unknown solid to be 81.9 to 82.3 degrees celsius.…
A: a) The range of melting point given is 81.9˚C to 82.3˚C. Since this range is very small (< 2˚C),…
Q: Explain briefly the percent volume and percent retrieval in separation of mixtures.
A:
Q: PAPER CHROMATOGRAPHY Additional details: 20mL distilled water + 20mL 95% ethyl alcohol solution was…
A: In paper chromatography, the paper sheet is used as stationary phase and the Water- ethanol mixture…
Q: lable Preparatiol Of Standard affeine SOlutions Standard [Caffeine] (mg L-1 or ppm) Volume of Volume…
A: Standard [Caffeine], mg /L or ppm Vol of caffeine stock, mL Vol of internal standard, mL…
Q: What are the steps in diluting high concentration of stock solutions into lower concentration…
A: During dilution, concentration changes but no of moles remain same. So, M1V1 = M2V2 Let-…
Q: Prepare 1500mL of 0.5N H2SO4 solution with specific gravity of 1.84g/mL and assay of 97%
A: Given Volume of solution = 1500ml Normality = 0.5 N Specific gravity = 1.84 g/ ml % solution = 97

Step by step
Solved in 2 steps with 1 images


- (vi) Complete the following statementComponent A spends ___ times as much time on the stationary phase as in the mobile phase;component B spends ___ times as much time on the stationary phase as in the mobile phase.Virial equation can be written in Z (compressibility factor form): Z = pV/RT = 1 + B'p + C'p2 + D'p3 + ... Z = 1 + (B/V) + (C/V2) + (D/V3) + ... Show that C'=(C-B2)/(RT)2 on each Z (compressibility factor form) above.m-chloroaniline + NaNO2 / HCl / zero degrees, then H3PO2 -->
- Use benzene as calibrating liquid. (ŋbenzene = 0.6516 cP) Use 4 decimal places. Room Temp: 20°C. kindly answer 1 2 and 3 onlyViscosity of Liquids Complete the following tables with the correct data needed for each number. Show all pertinent computations. Express your answers in 4 decimal places. Please keep your units consistent while calculating for the answers. Enclose in a box/highlight your final answers. thank you kindly answer 4,5, and 6 onlyWhy do meltiing, freezing and boiling point varies and depends on a kind of matter? Not less than 6 sentences.
- Can someone help with this multistep sytheisis and explain why they got their answers.The average normal body temperature is generally accepted as 98.6 F. What is the temperature in C and K ?At a temperature of -273.15 deg. C, this phase of matter exists: Bose-Einstein Condensates Liquid Crystals Neutrino Plasma If a certain hydrogen peroxide solution is 20-volume hydrogen peroxide, it contains: I. 3% Hydrogen Peroxide II. 6% Hydrogen Peroxide III. 10 mL Oxygen IV. 20 mL Oxygen II, IV IV I, III I, IV II, III
- In what absolute temperature will a given sample of ammonia at 300K and a critical temperature of 132 degrees celsius be in a corresponding state with carbon dioxide whose critical temperature is 31.2 degrees celsius? (The answer should be in three significant figures)13.Calibration must be properly done to ensure that glass ware and equipment are in good working condition. Anybody can perform calibration of an equipment.a.Both statements are correctb.Both statements are incorrectc.The first statement is incorrect while the second statement is correctd.The first statement is correct while the second statement us incorrect14.Glass measures are preferred for measuring liquids becausea.All of theseb.It is easy to handlec.Of its coefficient of expansiond.Transparency of the glass can more accurately indicate volumeThe average normal body temperatureis generally accepted as 98.6 °F. What is the temperature in °C and K?