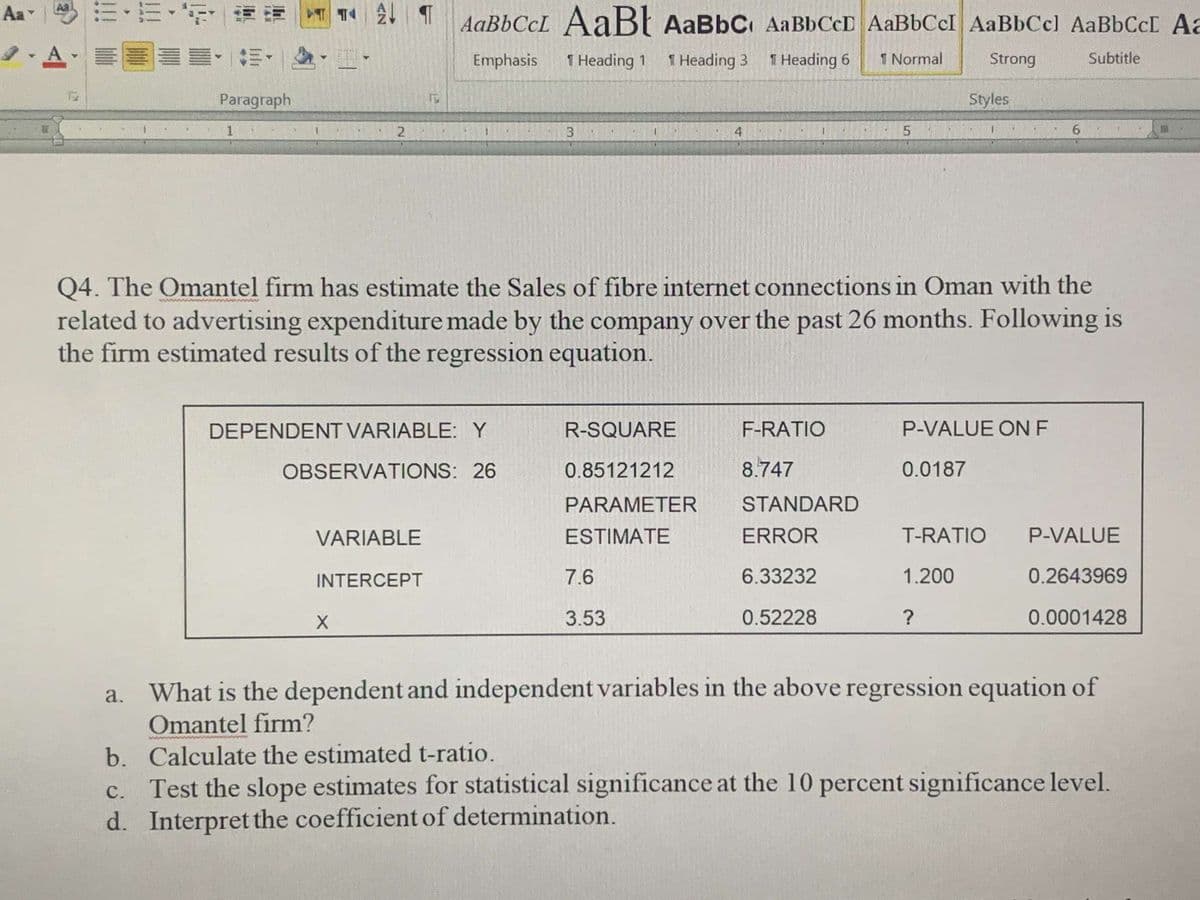
Q4. The Omantel firm has estimate the Sales of fibre internet connections in Oman with the related to advertising expenditure made by the company over the past 26 months. Following is the firm estimated results of the regression equation. DEPENDENT VARIABLE: Y R-SQUARE F-RATIO P-VALUE ON F OBSERVATIONS: 26 0.85121212 8.747 0.0187 PARAMETER STANDARD VARIABLE ESTIMATE ERROR T-RATIO P-VALUE INTERCEPT 7.6 6.33232 1.200 0.2643969 3.53 0.52228 0.0001428 a. What is the dependent and independent variables in the above regression equation of Omantel firm? b. Calculate the estimated t-ratio. c. Test the slope estimates for statistical significance at the 10 percent significance level.
Q: Below is some of the regression output from a regression of the amount rental houses on an island…
A: Question 29 The estimated equation is Price=1392+0.31*Size+1,987*View+0.05*Size*View. The predicted…
Q: A statistics professor wants to determine how students' final grades are related to mid-term exam…
A: Excel is used to perform the required multiple regression analysis. Steps are as; Enter the data…
Q: c. Does Vanguard's advertising expenditure have a statistically significant effect on the sales of…
A: c. The pvalue of A i.e. vanguard's expenditure on advertisement is 0.0128 which is less than 0.05…
Q: Delicacies Above the Rest, a high-end United States based restaurant in Montego bay, used regression…
A: The following information has been given: ∑ x =270 , ∑y =360n∑ x2 =10818 , ∑y2 =18107n∑ xy =14102…
Q: The manufacturer of Beanie Baby dolls used quarterly price data for 2012/-2020/V (t = 1, ..., 36)…
A: The level of significance is 0.02.
Q: following estimated regression model was developed relating yearly income (y in $1000s) of 30…
A:
Q: Below is some of the regression output from a regression of the amount rental houses on an island…
A: Given, Price=1474 + 0.31*Size + 1885*View + 0.1*(Size*View) View=1 if it has an ocean front view0…
Q: The manufacturer of Beanie Baby dolls used quarterly price data for 2005 /-2013 /V(1= 1,..., 36) and…
A: * SOLUTION :- (5) Given that ,
Q: The owner of a movie theater company used multiple regression analysis to predict gross revenue (y)…
A: The question is about multiple regression Given : y^ = 83.8 + 2.29 x1 + 1.30 x2 Sample no. of weeks…
Q: The manufacturer of Beanie Baby dolls used quarterly price data for 2005 - 2013 IV (t= 1,..., 36)…
A:
Q: Dr. Zion measures the relationship between two variables X (exam anxiety) and Y (performance) and…
A: Given Information: Participant X Y1 10 72 8 63…
Q: In an experiment an analyst has observed that SSxy equals 212.35, SSx equals 237.16 and SSy =…
A: Given values: SSXY=-212.35 SSX=237.16 SSY=858.49
Q: A group of students measure the length and width of a random sample of beans. They are interested in…
A: d) Compute the slope of the regression line using the formula: b=rsysx Where, 'b' is the estimated…
Q: The below data on the production volume x and total cost y (in dollars) for a particular…
A: (a) The estimated cost for the next month can simply be calculated by substituting x=650 in the…
Q: The following table gives the data for the average temperature and the snow accumulation in several…
A: See the solution
Q: The proprietor of Cypres Recordings investigated the relationship between sales (y) and the amount…
A: 2) Given: x y 11 21 24 15 25 32
Q: Q3. For 17 observations on Price (X) and Supply (Y), the following data were obtained in appropriate…
A:
Q: please show work and fill in the blank
A:
Q: Eight pairs of data yield r = 0.708 and the regression equation v= 55.8+2.79x. Also, v=71125. What…
A: Linear regression is a linear approach to model the relationship between a dependent variable and…
Q: A local retail store compared their monthly sales of Umbrellas with the amount of rainfall that…
A: Solution: Given information: Let x = Rainfall (in) and y= Number of umbrellas x= 4.64y= 34.2Sx=…
Q: he following estimated regression equation is based on 10 observations was presented. ere SST…
A: SSR 6016.125 SST 6718.875 n 10 sb1 0.0861 sb2 0.0531 The regression equations:…
Q: The owner of a movie theater company used multipie regression analysis to predict gross revenue (y)…
A: The owner of a movie theater company used multiple regression analysis to predict gross revenue ) as…
Q: A researcher believes that there is a linear association between the level of potassium content (y)…
A: Solution: Given information: The estimated linear regression equation for predicting level of…
Q: he owner of a movie theater company used multiple regression analysis to predict gross revenue (y)…
A:
Q: A Director of Human Resources is exploring employee absenteeism at the INCOVA Hospital. A multiple…
A: Regression Coefficient: The coefficient in the regression equation implies how much the mean of the…
Q: A factory estimated the relationship between the number of labor hours (Independent) and the number…
A:
Q: The following regression output is for predicting the heart weight (in g) of cats from their body…
A: a) Linear model is y=-0.357+4.034*body weight where intercept = -0.357 slope = 4.034 b) Interpreting…
Q: Velocidad del aire (cm/s) Coeficiente de evaporación (mm²/s) 20 0.18 60 0.37 100 0.35 140 0.78 180…
A: Now, with the provided sample values of the predictor and the response variable, we need to…
Q: A factory estimated the relationship between the number of labor hours (Independent) and the number…
A:
Q: Delicacies Above the Rest, a high-end United States based restaurant in Montego bay, used regression…
A: Regression analysis is useful in predicting value of a response variable, for a given value of the…
Q: The arm span and foot length were both measured (in centimeters) for each of 20 students in a…
A: Given data:
Q: A sociologist is interested in the relation between ?, the number of job changes and ?, the annual…
A: x y 4 33 7 37 5 34 6 32 1 32 5 38 9 43 10 37 10 40 3 33 The simple linear…
Q: The following regression model was estimated. Q is the number of meals served, P is the average…
A: Hello! As you have posted more than 3 sub parts, we are answering the first 3 sub-parts. In case…
Q: A particular professor has noticed that the number of people, P, who complain about his attitude is…
A: Hi! Thank you for the question, as per the honor code, we are allowed to answer three sub-parts at a…
Q: A trucking company considered a multiple regression model for relating the dependent variable y =…
A: Solution: The estimated regression equation is y^=-0.800+0.060×x1+0.900×x2
Q: The proprietor of Cypres Recordings investigated the relationship between sales ) and the amount…
A: Hi! Thank you for the question, As per the honor code, we are allowed to answer one question at a…
Q: Accountants at the GIll Co and Charted Brothers Accounting believed that several traveling…
A: *Answer:
Q: he admissions officer for Clearwater College developed the following estimated regression equation…
A: Given Information: The admissions officer for Clearwater college developed the following estimated…
Q: The manufacturer of Beanie Baby dolls used quarterly price data for 2012/-2020/V(t = 1, ..., 36) and…
A:
Q: The following data are the monthly salaries y and the grade point averages x for students who…
A: Given data is GPA Monthly salary($) 2.6 3300 3.4 3600 3.6 4000 3.2 3500 3.5 3900 2.9…
Q: The following regression model was estimated. Q is the number of meals served, P is the average…
A: Hello. Since your question has multiple sub-parts, we will solve first three sub-parts for you. If…
Q: Consider the following data on x = weight (pounds) and y = price ($) for 10 road-racing bikes.…
A: Given information SSE = 7,209,342.96 and SST = 50,969,800. SSR = 50,969,800 - 7,209,342.96 =…
Q: The owner of a movie theater company used multiple regression analysis to predict gross revenue (y)…
A: Multiple linear regression model: A multiple linear regression model is given as y = b0 + b1x1 +…
Q: The following table gives the data for the average temperature and the snow accumulation in several…
A: Given As per given data enter in to the Excel sheet
Q: The estimated regression equation for a model involving two independent variables and 10…
A: Solution
Q: a. Determine the correlation coefficient between the percentage of teenagers who have used Drug 1…
A: Please find the solution Given data: x 23 18 39 4 36 19 23 7 8 54 34 y 5 4 21 0 17 8 15 2 2…
Q: he last two variables are entered into the regression as centered around their mean, Mom_Age_Cntrd…
A:
Q: Accountants at the GIll Co and Charted Brothers Accounting believed that several traveling…
A: a) Answer: The null hypothesis is rejected. At a 5% significance level, there is sufficient evidence…
Q: A survey was conducted to study the retationship between expenditure on accommodation (X) and…
A:
Q: The owner of a movie theater company used multiple regression analysis to predict gross revenue (y)…
A:
Step by step
Solved in 5 steps with 1 images
- A sociologist was hired by a large city hospital to investigate the relationship between the number of unauthorized days that employees are absent per year and the distance (miles) between home and work for the employee. A sample of 10 employees was chosen, and the following data were collected. A. Is the estimated regression equation appropriate and adequateAccording to World Health Organization (WHO), the recommended limit for a noise level inside a classroom is 35 dBA. However, nine out of ten schools fail to meet this recommendation. A researcher wishes to conduct a study relevant to the prior information, but as a gap, he decides to include the area (in square meters) of every classroom and how it could possibly affect the resulting noise level. He selects 17 classrooms at random, and the noise levels are recorded in the next slide. a. Find the regression equation and construct the scatter plot diagram. b. Predict the noise level if a classroom has an area of 85.97 m2 . c. Calculate the coefficient of determination and interpret the findings. d. Calculate the coefficient of alienation and interpret the findings. Use ExcelThe systolic blood pressure dataset (in the third sheet of the spreadsheet linked above) contains the systolic blood pressure and age of 30 randomly selected patients in a medical facility. What is the equation for the least square regression line where the independent or predictor variable is age and the dependent or response variable is systolic blood pressure? Y=__________ X + ______________ Patient 7 is 67 years old and has a systolic blood pressure of 170 mm Hg. What is the residual? __________ mm Hg Is the actual value above, below, or on the line? What is the interpretation of the residual? (difference in actual &predicated bp, difference in age, the amount of systolic changes)
- The accompanying data resulted from an experiment in which weld diameter and shear strength (in pounds) were determined for five different spot welds on steel. Below are the data collected and the regression equation. Diameter Strength 200.1 813.7 210.1 785.3 220.1 960.4 230.1 1118.0 240.0 1076.2 Strength = -941.6992 + 8.5988*Diameter The predicted y-hat value for a diameter of 201 is 864. if we observed a weld that had a diameter of 235 that had a strength 1000, what would be its residual?A Ross MAP team is currently developing a regression model to explain the travel expense of HR consulting firms in a month (measured in thousands of dollars). So far, the team has identified the number of consultants, the number of clients, the number of air-travel trips, and the number of trips to high-expense cities (e.g., NYC, Boston, San Jose) as potential independent variables. A partial output of the corresponding regression model is in Figure 1. Use the figure to answer question 4to6 4. What is the R2 and adjusted R2 of the model? 5. What is the standard error of the estimates (serror) in thousands of dollars? 6. Based on what you can learn from this table, what is your assessment about the model? For your information, the firm with the lowest travel expense was $47K and the firm with the highest expense was $125K in the sample data.The linregress() method in scipy module is used to fit a simple linear regression model using “Reaction” (reaction time) as the response variable and “Drinks” as the predictor variable. The output is shown below. What is the correct regression equation based on this output? Is this model statistically significant at 5% level of significance (alpha = 0.05)? Select one. Python script outputs for the linregress method. Slope equals 6.0000, intercept = 3.9999, rvalue = 0.9728, pvalue = 0.0011, stderror = 0.7141. Note: Python output shows many decimal places. All values Question 2 options: Reaction = 6.0000 + 3.9999 Drinks, model is not statistically significant Reaction = 6.0000 + 3.9999 Drinks, model is statistically significant Reaction = 3.9999 + 6.0000 Drinks, model is not statistically significant Reaction = 3.9999 + 6.0000 Drinks, model is statistically significant
- The Wall Street Journal asked Concur Technologies, Inc., an expense management company, to examine data from 8.3 million expense reports to provide insights regarding business travel expenses. Their analysis of the data showed that New York was the most expensive city. The following table shows the average daily hotel room rate (X) and the average amount spent on entertainment (Y) for a random sample of 9 of the 25 most-visited U.S. cities. These data lead to the estimated regression equation y = 17.49 + 1.0334x. For these data SSE = 1541.4. Use Table 1 of Appendix B. a. Predict the amount spent on entertainment for a particular city that has a daily room rate of $89 (to 2 decimals). b. Develop a 95% confidence interval for the mean amount spent on entertainment for all cities that have a daily room rate of $89 (to 2 decimals). c. The average room rate in Chicago is $128. Develop a 95% prediction interval for the amount spent on entertainment in Chicago (to 2 decimals).The Wall Street Journal asked Concur Technologies, Inc., an expense management company, to examine data from 8.3 million expense reports to provide insights regarding business travel expenses. Their analysis of the data showed that New York was the most expensive city. The following table shows the average daily hotel room rate (X) and the average amount spent on entertainment (Y) for a random sample of 9 of the 25 most-visited U.S. cities. These data lead to the estimated regression equation y = 17.49 + 1.0334x. For these data SSE = 1541.4. Use Table 1 of Appendix B. (NEED ANSWER FOR A) a. Predict the amount spent on entertainment for a particular city that has a daily room rate of $89 (to 2 decimals).The owner of Original Italian Pizza restaurant chain wants to understand which variable most strongly influences the sales of his specialty deep-dish pizza. He has gathered data on the monthly sales of deep-dish pizzas at his restaurants and observations on other potentially relevant variables for each of several outlets in central Indiana. These data are provided in the file P10_04.xlsx. Estimate a simple linear regression equation between the quantity sold (Y) and each of the following candidates for the best explanatory variable: average price of deep-dish pizzas (X1), monthly advertising expenditures (X2), and disposable income per household in the areas surrounding the outlets (X3). Round your answers for intercept coefficients to the nearest whole number and slope coefficients to two decimal places, if necessary. If your answer is negative number, enter "minus" sign.
- Suppose the following data were collected from a sample of 15 houses relating selling price to square footage and the architectural style of the house. Use statistical software to find the following regression equation: PRICEi=b0+b1SQFTi+b2COLONIALi+b3RANCHi+ei . Is there enough evidence to support the claim that on average, houses that are ranch style have lower selling prices than houses that are Victorian style at the 0.05 level of significance? If yes, write the regression equation in the spaces provided with answers rounded to two decimal places. Else, select "There is not enough evidence."Selling Price Square Footage Colonial (1 if house is Colonial style, 0 otherwise) Ranch (1 if house is Ranch style, 0 otherwise) Victorian (1 if house is Victorian style, 0 otherwise) 377640 1941 1 0 0 460996 3397 0 1 0 405781 2764 0 0 1 407216 2906 0 0 1 435139 3401 1 0 0 405275 2600 0 0 1 381141 2203 0 1 0 370490 2046 1 0 0 404070 2210 0 0 1 460196 3692 0 1 0 382780 2172 1 0 0 406466 2606 0 1…The sheet called HousePr contains data on prices of houses that have sold recently and two attributes of the house – the number of bedrooms and the size. Column 1 is the selling price of the house in thousands of dollars and column 2 is the size in hundreds of square feet.A. What is the expected price for a house with size 2000 square feet? Using relevant Excel output, discuss whether the margin of error of this expected price will be low or high.B. Using Excel, obtain the equation of the linear regression line that fits this data for price vs. number of bedrooms. Is the true slope different from zero?C. Which of these two variables – number of bedrooms or size, is the better predictor for price and why? Price SqrFoot Bedrooms731 21 4901 22 4736 16 3866 19 3697 12 2836 17 3694 17 3843 18 3721 15 4883 18 2913 17 3868 17 3642 17 3884 17 3810 16 2841 16 3779 17 4726 16 3667 14 2870 21 4834 16 2776 19 4681 14 2846 19 4917 20 4946 23 5813 20 4911 18 3723 17 3711 15 2897 19 4881 22 4863 19…In a manufacturing process the assembly line speed (feet per minute) was thought toaffect the number of defective parts found during the inspection process. To test thistheory, managers devised a situation in which the same batch of parts was inspectedvisually at a variety of line speeds. They collected the following data.Line SpeedNumber of DefectiveParts Found20 2120 1940 1530 1660 1440 17a. Develop the estimated regression equation that relates line speed to thenumber of defective parts found.b. At a .05 level of significance, determine whether line speed and number ofdefective parts found are related.c. Did the estimated regression equation provide a good fit to the data?d. Develop a 95% confidence interval to predict the mean number of defectiveparts for a line speed of 50 feet per minute.