
ENGR.ECONOMIC ANALYSIS
14th Edition
ISBN: 9780190931919
Author: NEWNAN
Publisher: Oxford University Press
expand_more
expand_more
format_list_bulleted
Related questions
Question
All information provided

Transcribed Image Text:QUANTITY OF OUTPUT (Pizzas)
++ + +H
S PhotoGrid
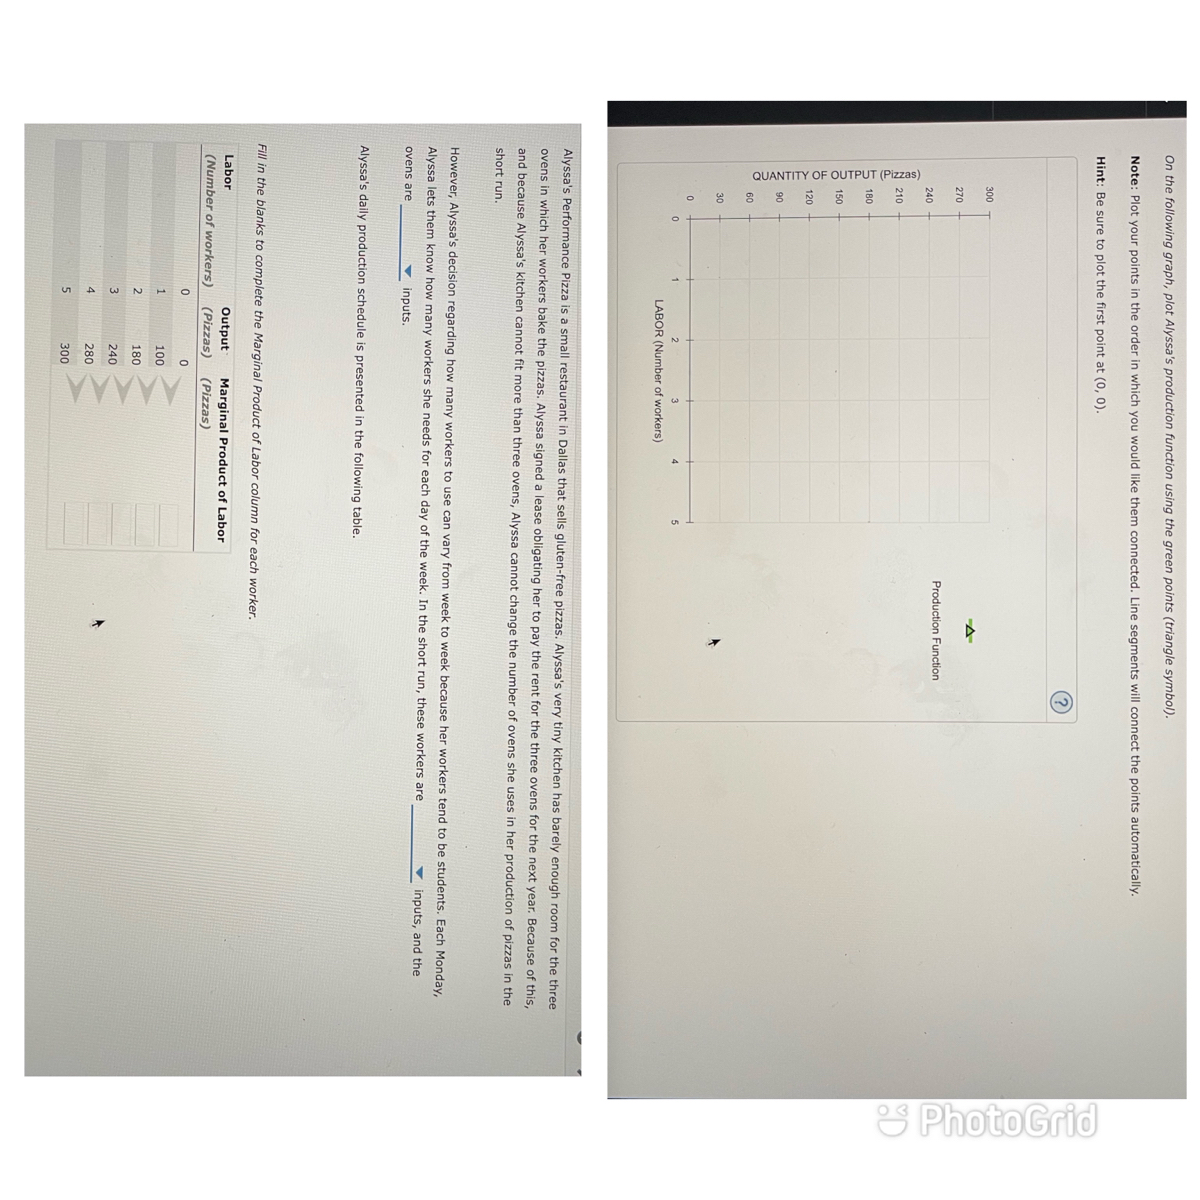
On the following graph, plot Alyssa's production function using the green points (triangle symbol).
Note: Plot your points in the order in which you would like them connected. Line segments will connect the points automatically.
Hint: Be sure to plot the first point at (0, 0).
300
270
Production Function
240
210
180
150
120
60
30
LABOR (Number of workers)
Alyssa's Performance Pizza is a small restaurant in Dallas that sells gluten-free pizzas. Alyssa's very tiny kitchen has barely enough room for the three
ovens in which her workers bake the pizzas. Alyssa signed a lease obligating her to pay the rent for the three ovens for the next year. Because of this,
and because Alyssa's kitchen cannot fit more than three ovens, Alyssa cannot change the number of ovens she uses in her production of pizzas in the
short run.
However, Alyssa's decision regarding how many workers to use can vary from week to week because her workers tend to be students. Each Monday,
Alyssa lets them know how many workers she needs for each day of the week. In the short run, these workers are
v inputs, and the
ovens are
v inputs.
Alyssa's daily production schedule is presented in the following table.
Fill in the blanks to complete the Marginal Product of Labor column for each worker.
Labor
Output
Marginal Product of Labor
(Number of workers)
(Pizzas)
(Pizzas)
100
2
180
240
4.
280
300

Transcribed Image Text:TOTAL COST (Dollars)
S PhotoGrid
True or False: The shape of the production function reflects the law of increasing marginal returns.
O True
False
Suppose that labor is Alyssa's only variable cost and that she has a fixed cost of $50 per day and pays each of her workers $40 per day.
Use the orange points (square symbol) to plot Alyssa's total cost curve on the following graph using the quantities from the preceding table.
300
270
240
Total Cost
210
180
150
120
90
60
30
30
60
90
120
150
180
210
240
270
300
QUANTITY OF OUTPUT (Pizzas)
Expert Solution
This question has been solved!
Explore an expertly crafted, step-by-step solution for a thorough understanding of key concepts.

This is a popular solution

Trending nowThis is a popular solution!

Step by stepSolved in 3 steps with 4 images

Knowledge Booster


Learn more about
Need a deep-dive on the concept behind this application? Look no further. Learn more about this topic, economics and related others by exploring similar questions and additional content below.Similar questions
arrow_back_ios
arrow_forward_ios
Recommended textbooks for you
 Principles of Economics (12th Edition)EconomicsISBN:9780134078779Author:Karl E. Case, Ray C. Fair, Sharon E. OsterPublisher:PEARSON
 Engineering Economy (17th Edition)EconomicsISBN:9780134870069Author:William G. Sullivan, Elin M. Wicks, C. Patrick KoellingPublisher:PEARSON
 Principles of Economics (MindTap Course List)EconomicsISBN:9781305585126Author:N. Gregory MankiwPublisher:Cengage Learning
 Managerial Economics: A Problem Solving ApproachEconomicsISBN:9781337106665Author:Luke M. Froeb, Brian T. McCann, Michael R. Ward, Mike ShorPublisher:Cengage Learning
 Managerial Economics & Business Strategy (Mcgraw-...EconomicsISBN:9781259290619Author:Michael Baye, Jeff PrincePublisher:McGraw-Hill Education
Principles of Economics (12th Edition)
Economics
ISBN:9780134078779
Author:Karl E. Case, Ray C. Fair, Sharon E. Oster
Publisher:PEARSON
Engineering Economy (17th Edition)
Economics
ISBN:9780134870069
Author:William G. Sullivan, Elin M. Wicks, C. Patrick Koelling
Publisher:PEARSON
Principles of Economics (MindTap Course List)
Economics
ISBN:9781305585126
Author:N. Gregory Mankiw
Publisher:Cengage Learning
Managerial Economics: A Problem Solving Approach
Economics
ISBN:9781337106665
Author:Luke M. Froeb, Brian T. McCann, Michael R. Ward, Mike Shor
Publisher:Cengage Learning
Managerial Economics & Business Strategy (Mcgraw-...
Economics
ISBN:9781259290619
Author:Michael Baye, Jeff Prince
Publisher:McGraw-Hill Education