QUESTION 2: The percentages of some items related to the Balance Sheet and Income Statements of XYZ Sanayi ve Ticaret A.Ş. for the years 2016-2017-2018-2019 and 2020, obtained by using the Trend Percentages (Trend) Analysis Method, are given in the table below. transactions Stocks 2016 2017 2018 2019 2020 100 240 350 570 1200 Current Assets Tangible Fixed Assets Short-Term Liabilities Net Sales 100 140 100 110 280 470 990 150 400 100 160 310 490 1050 100 200 300 530 1000 Desired: Using the trend percentages in the table above; • Current Assets-Inventories Relationship, • Tangible Assets-Net Sales Relationship, • Interpret the Current Assets-Short-Term Liabilities relationship.
QUESTION 2: The percentages of some items related to the Balance Sheet and Income Statements of XYZ Sanayi ve Ticaret A.Ş. for the years 2016-2017-2018-2019 and 2020, obtained by using the Trend Percentages (Trend) Analysis Method, are given in the table below. transactions Stocks 2016 2017 2018 2019 2020 100 240 350 570 1200 Current Assets Tangible Fixed Assets Short-Term Liabilities Net Sales 100 140 100 110 280 470 990 150 400 100 160 310 490 1050 100 200 300 530 1000 Desired: Using the trend percentages in the table above; • Current Assets-Inventories Relationship, • Tangible Assets-Net Sales Relationship, • Interpret the Current Assets-Short-Term Liabilities relationship.

Century 21 Accounting General Journal
11th Edition
ISBN:9781337680059
Author:Gilbertson
Publisher:Gilbertson
Chapter17: Financial Statement Analysis
Section: Chapter Questions
Problem 3AP

Related questions
Question
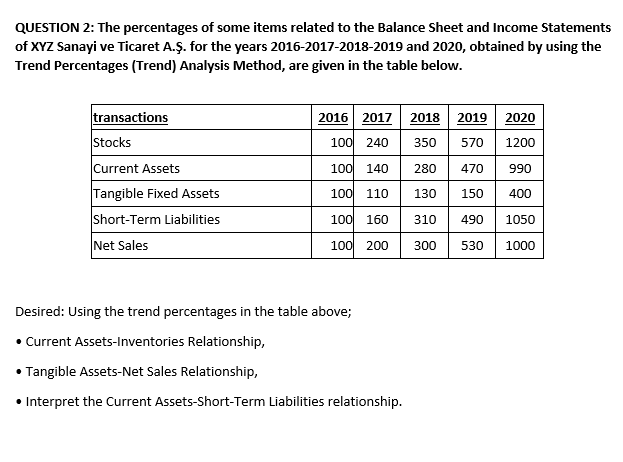
Transcribed Image Text:QUESTION 2: The percentages of some items related to the Balance Sheet and Income Statements
of XYZ Sanayi ve Ticaret A.Ş. for the years 2016-2017-2018-2019 and 2020, obtained by using the
Trend Percentages (Trend) Analysis Method, are given in the table below.
transactions
Stocks
Current Assets
2016 2017 2018 2019 2020
100 240
350
570
1200
100 140
990
Tangible Fixed Assets
100 110
130
150
400
Short-Term Liabilities
Net Sales
100 160
310
490
1050
100 200
300
530
1000
Desired: Using the trend percentages in the table above;
• Current Assets-Inventories Relationship,
• Tangible Assets-Net Sales Relationship,
• Interpret the Current Assets-Short-Term Liabilities relationship.
Expert Solution
This question has been solved!
Explore an expertly crafted, step-by-step solution for a thorough understanding of key concepts.

Step by step
Solved in 4 steps

Knowledge Booster


Learn more about
Need a deep-dive on the concept behind this application? Look no further. Learn more about this topic, accounting and related others by exploring similar questions and additional content below.Recommended textbooks for you

Cornerstones of Financial Accounting
Accounting
ISBN:
9781337690881
Author:
Jay Rich, Jeff Jones
Publisher:
Cengage Learning

Financial Accounting: The Impact on Decision Make…
Accounting
ISBN:
9781305654174
Author:
Gary A. Porter, Curtis L. Norton
Publisher:
Cengage Learning
Cornerstones of Financial Accounting
Accounting
ISBN:
9781337690881
Author:
Jay Rich, Jeff Jones
Publisher:
Cengage Learning
Financial Accounting: The Impact on Decision Make…
Accounting
ISBN:
9781305654174
Author:
Gary A. Porter, Curtis L. Norton
Publisher:
Cengage Learning

Intermediate Accounting: Reporting And Analysis
Accounting
ISBN:
9781337788281
Author:
James M. Wahlen, Jefferson P. Jones, Donald Pagach
Publisher:
Cengage Learning

Survey of Accounting (Accounting I)
Accounting
ISBN:
9781305961883
Author:
Carl Warren
Publisher:
Cengage Learning

Financial Accounting
Accounting
ISBN:
9781337272124
Author:
Carl Warren, James M. Reeve, Jonathan Duchac
Publisher:
Cengage Learning