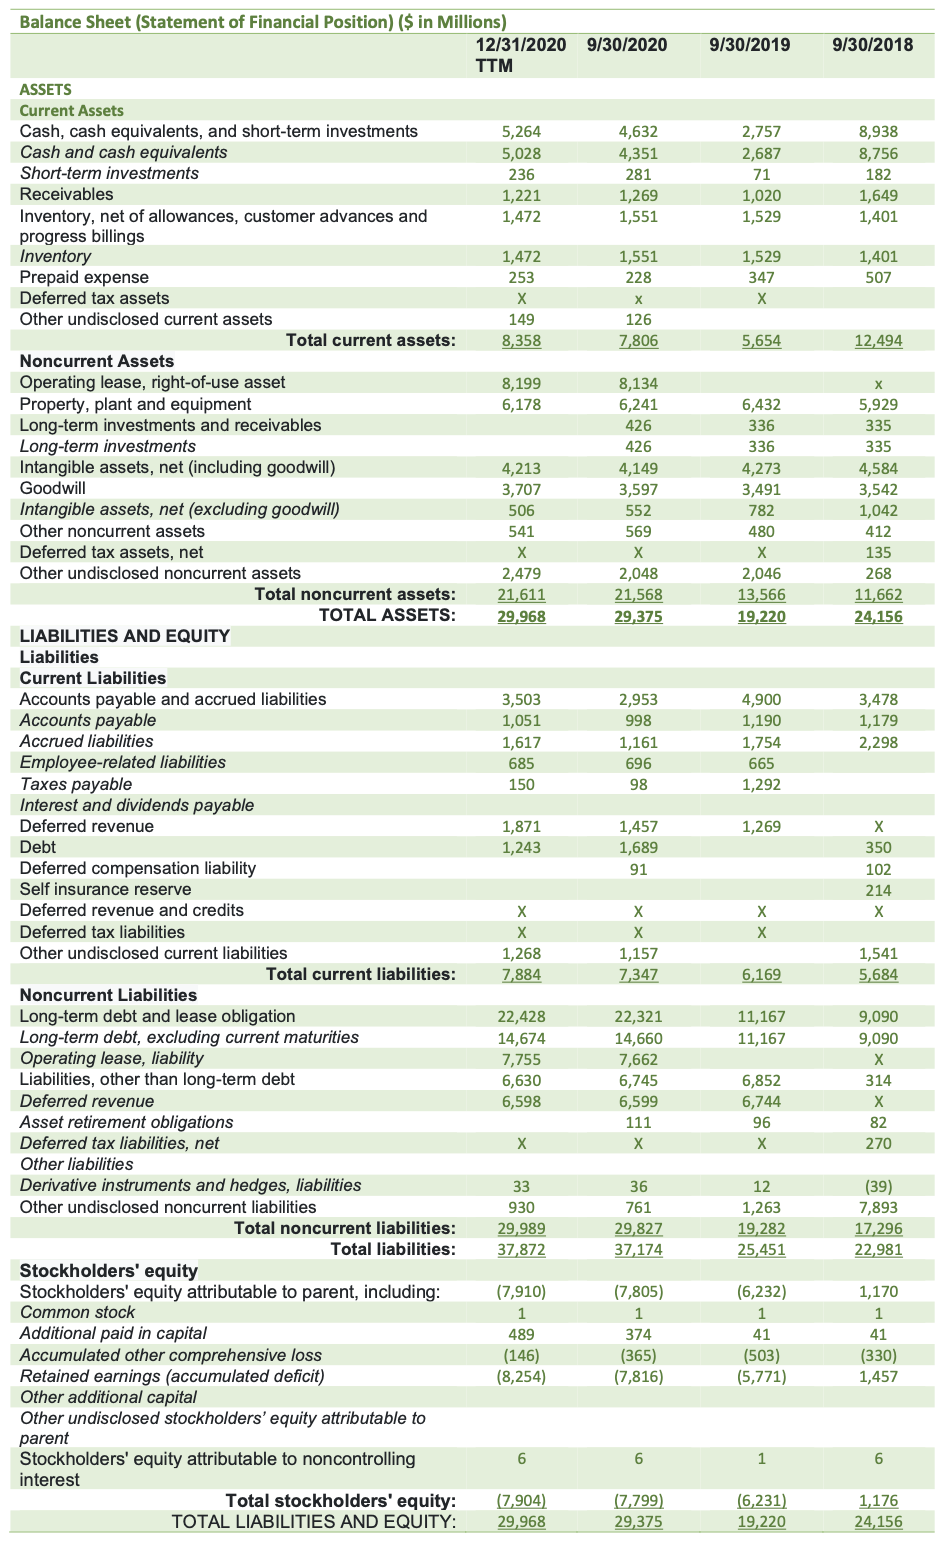
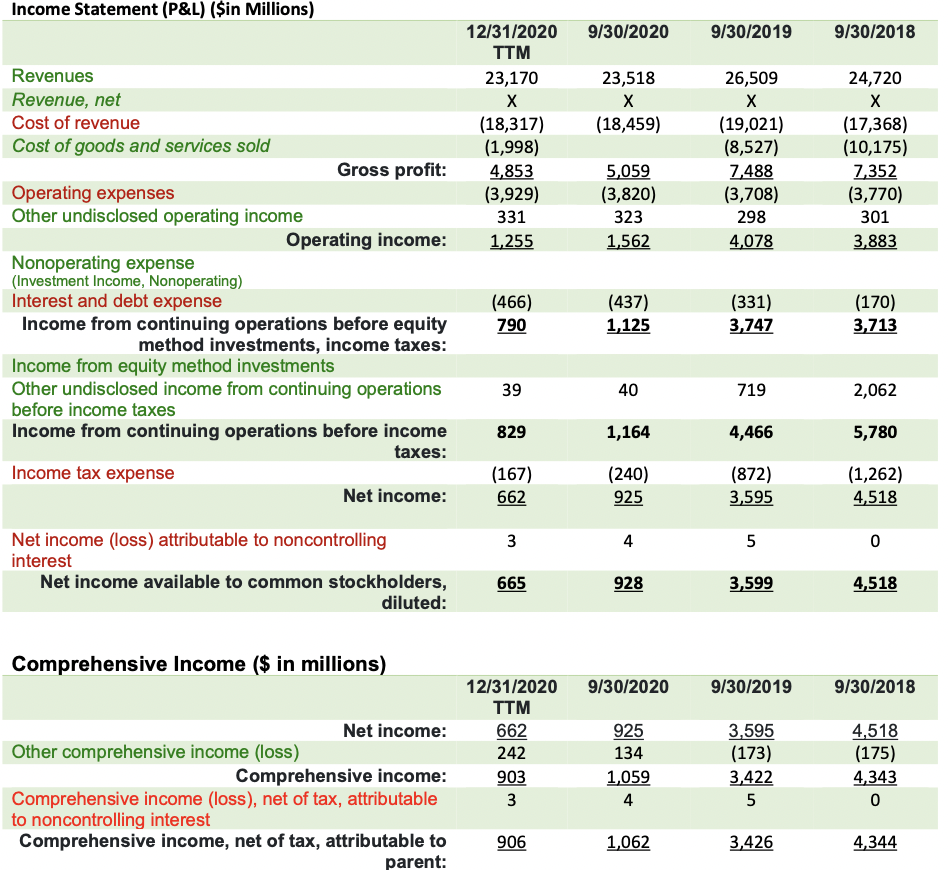
Analyze the financial statements of the company to you in terms of: 1. Debt Management Ratio * TIE Ratio or Time Interest Earned Ratio 2. Asset Management Ratio *Inventory Turnover Ratio *Fixed Asset Turnover Ratio *Total Asset Turnover Ratio 2020 Analysis BUT also compare with 2018 - 2019. Show solution on computaion.
Analyze the financial statements of the company to you in terms of: 1. Debt Management Ratio * TIE Ratio or Time Interest Earned Ratio 2. Asset Management Ratio *Inventory Turnover Ratio *Fixed Asset Turnover Ratio *Total Asset Turnover Ratio 2020 Analysis BUT also compare with 2018 - 2019. Show solution on computaion.
Chapter1: Financial Statements And Business Decisions
Section: Chapter Questions
Problem 1Q
Related questions
Question
100%
Analyze the financial statements of the company to you in terms of:
1. Debt Management Ratio * TIE Ratio or Time Interest Earned Ratio
2. Asset Management Ratio *Inventory Turnover Ratio *Fixed Asset Turnover Ratio *Total Asset Turnover Ratio
2020 Analysis BUT also compare with 2018 - 2019.
Show solution on computaion.

Transcribed Image Text:Balance Sheet (Statement of Financial Position) ($ in Millions)
12/31/2020
9/30/2020
9/30/2019
9/30/2018
TTM
ASSETS
Current Assets
Cash, cash equivalents, and short-term investments
Cash and cash equivalents
5,264
5,028
4,632
2,757
8,938
4,351
2,687
8,756
Short-term investments
236
281
71
182
Receivables
1,649
1,221
1,472
1,269
1,020
Inventory, net of allowances, customer advances and
progress billings
Inventory
Prepaid expense
Deferred tax assets
1,551
1,529
1,401
1,472
1,551
1,529
1,401
253
228
347
507
Other undisclosed current assets
149
126
Total current assets:
8,358
7,806
5,654
12,494
Noncurrent Assets
Operating lease, right-of-use asset
Property, plant and equipment
Long-term investments and receivables
Long-term investments
Intangible assets, net (including goodwill)
Goodwill
8,199
6,178
8,134
6,241
6,432
5,929
426
336
335
426
336
335
4,213
4,149
4,273
4,584
3,542
1,042
3,707
3,597
3,491
Intangible assets, net (excluding goodwill)
Other noncurrent assets
Deferred tax assets, net
506
552
782
541
569
480
412
X
135
Other undisclosed noncurrent assets
2,048
21,568
2,046
13,566
2,479
268
Total noncurrent assets:
21,611
11,662
24,156
TOTAL ASSETS:
29,968
29,375
19,220
LIABILITIES AND EQUITY
Liabilities
Current Liabilities
Accounts payable and accrued liabilities
Accounts payable
3,478
1,179
3,503
2,953
4,900
1,051
998
1,190
Accrued liabilities
1,617
1,161
1,754
2,298
Employee-related liabilities
Taxes payable
Interest and dividends payable
Deferred revenue
685
696
665
150
98
1,292
1,871
1,243
1,457
1,269
X
Debt
Deferred compensation liability
Self insurance reserve
1,689
350
91
102
214
Deferred revenue and credits
Deferred tax liabilities
X
Other undisclosed current liabilities
1,268
1,157
1,541
Total current liabilities:
7,884
7,347
6,169
5,684
Noncurrent Liabilities
Long-term debt and lease obligation
Long-term debt, excluding current maturities
Operating lease, liability
Liabilities, other than long-term debt
Deferred revenue
Asset retirement obligations
Deferred tax liabilities, net
22,428
22,321
11,167
9,090
14,674
14,660
11,167
9,090
7,755
7,662
6,745
6,630
6,598
6,852
6,744
314
6,599
111
96
82
X
270
Other liabilities
Derivative instruments and hedges, liabilities
Other undisclosed noncurrent liabilities
(39)
7,893
17,296
33
36
12
930
761
1,263
29,989
37,872
29,827
37,174
Total noncurrent liabilities:
19,282
25,451
Total liabilities:
22,981
Stockholders' equity
Stockholders' equity attributable to parent, including:
Common stock
(7,910)
(7,805)
(6,232)
1,170
1
1
1
1
Additional paid in capital
Accumulated other comprehensive loss
Retained earnings (accumulated deficit)
Other additional capital
489
374
41
41
(365)
(7,816)
(503)
(5,771)
(146)
(330)
1,457
(8,254)
Other undisclosed stockholders' equity attributable to
parent
Stockholders' equity attributable to noncontrolling
interest
6.
1
Total stockholders' equity:
TOTAL LIABILITIES AND EQUITY:
1,176
24,156
(7,904)
(7,799)
(6,231)
29,968
29,375
19,220

Transcribed Image Text:Income Statement (P&L) ($in Millions)
12/31/2020
9/30/2020
9/30/2019
9/30/2018
TTM
Revenues
23,170
23,518
26,509
24,720
Revenue, net
Cost of revenue
(17,368)
(10,175)
7,352
(3,770)
(18,317)
(1,998)
(18,459)
(19,021)
(8,527)
Cost of goods and services sold
Gross profit:
4,853
(3,929)
5,059
(3,820)
7,488
(3,708)
Operating expenses
Other undisclosed operating income
331
323
298
301
Operating income:
1,255
1,562
4,078
3,883
Nonoperating expense
(Investment Income, Nonoperating)
Interest and debt expense
Income from continuing operations before equity
(466)
790
(331)
3,747
(170)
3,713
(437)
1,125
method investments, income taxes:
Income from equity method investments
Other undisclosed income from continuing operations
before income taxes
39
40
719
2,062
Income from continuing operations before income
829
1,164
4,466
5,780
taxes:
Income tax expense
(167)
662
(872)
3,595
(1,262)
(240)
925
Net income:
4,518
Net income (loss) attributable to noncontrolling
interest
3
4
5
Net income available to common stockholders,
diluted:
665
928
3,599
4,518
Comprehensive Income ($ in millions)
12/31/2020
TTM
662
9/30/2020
9/30/2019
9/30/2018
3,595
(173)
Net income:
925
4,518
(175)
4,343
Other comprehensive income (loss)
242
134
Comprehensive income:
Comprehensive income (loss), net of tax, attributable
903
1,059
3,422
3
4
5
to noncontrolling interest
Comprehensive income, net of tax, attributable to
parent:
906
1,062
3,426
4,344
Expert Solution
This question has been solved!
Explore an expertly crafted, step-by-step solution for a thorough understanding of key concepts.
Step by step
Solved in 2 steps with 1 images

Recommended textbooks for you


Accounting
Accounting
ISBN:
9781337272094
Author:
WARREN, Carl S., Reeve, James M., Duchac, Jonathan E.
Publisher:
Cengage Learning,

Accounting Information Systems
Accounting
ISBN:
9781337619202
Author:
Hall, James A.
Publisher:
Cengage Learning,


Accounting
Accounting
ISBN:
9781337272094
Author:
WARREN, Carl S., Reeve, James M., Duchac, Jonathan E.
Publisher:
Cengage Learning,

Accounting Information Systems
Accounting
ISBN:
9781337619202
Author:
Hall, James A.
Publisher:
Cengage Learning,

Horngren's Cost Accounting: A Managerial Emphasis…
Accounting
ISBN:
9780134475585
Author:
Srikant M. Datar, Madhav V. Rajan
Publisher:
PEARSON

Intermediate Accounting
Accounting
ISBN:
9781259722660
Author:
J. David Spiceland, Mark W. Nelson, Wayne M Thomas
Publisher:
McGraw-Hill Education

Financial and Managerial Accounting
Accounting
ISBN:
9781259726705
Author:
John J Wild, Ken W. Shaw, Barbara Chiappetta Fundamental Accounting Principles
Publisher:
McGraw-Hill Education