Compute the following ratios for the comparative periods (2018 and 2019). The company used 365 days in its computation for some of the ratios. Show your solution. d. Accounts Receivable Turnover Ratio e. Average Collection Period f. Inventory Turnover Ratio
Compute the following ratios for the comparative periods (2018 and 2019). The company used 365 days in its computation for some of the ratios. Show your solution. d. Accounts Receivable Turnover Ratio e. Average Collection Period f. Inventory Turnover Ratio

College Accounting, Chapters 1-27 (New in Accounting from Heintz and Parry)
22nd Edition
ISBN:9781305666160
Author:James A. Heintz, Robert W. Parry
Publisher:James A. Heintz, Robert W. Parry
Chapter15: Financial Statements And Year-end Accounting For A Merchandising Business
Section: Chapter Questions
Problem 4CE

Related questions
Question
1. Compute the following ratios for the comparative periods (2018 and 2019). The company used 365 days in its computation for some of the ratios. Show your solution.
d.
e. Average Collection Period
f. Inventory Turnover Ratio
g. Average Days in Inventory
h. Number of days in Operating Cycle
i. Debt to Total Assets Ratio
j. Debt to Equity Ratio
k. Times Interest Earned Ratio
l. Gross Profit Ratio
m. Profit Margin Ratio
n. Return on Assets
o. Return on Equity
p. Assets Turnover Ratio
Transcribed Image Text:What I Can Do
Activity 5.5. Solving the Problem
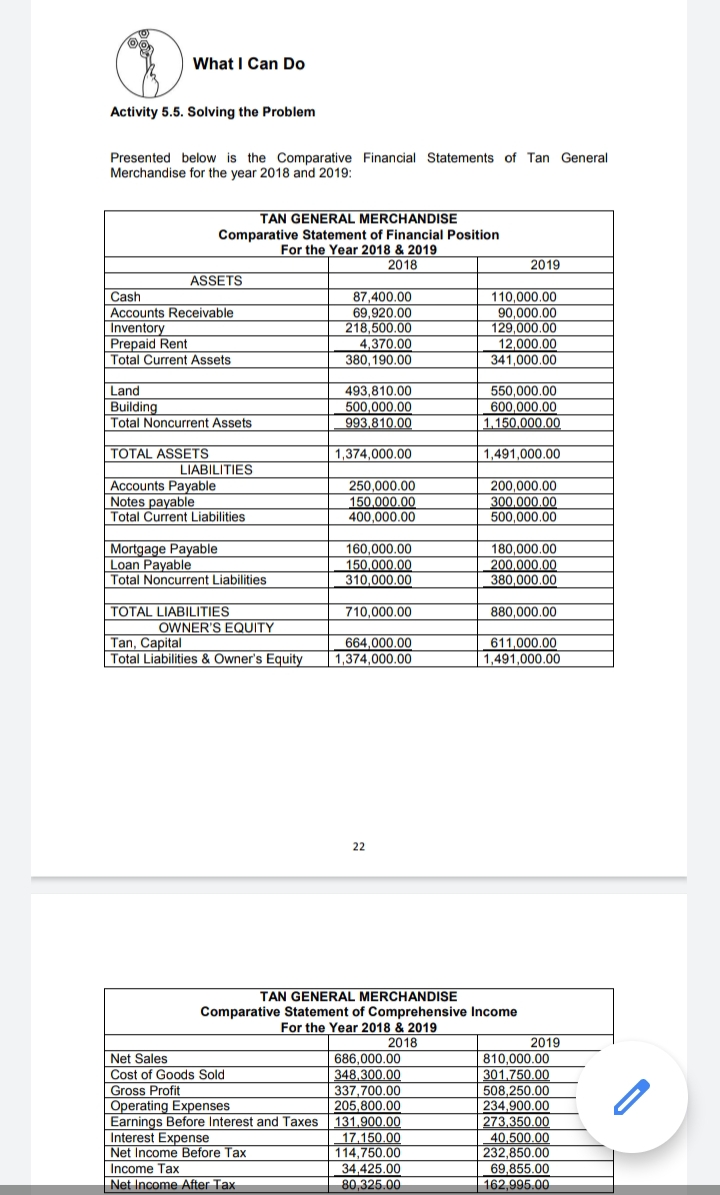
Presented below is the Comparative Financial Statements of Tan General
Merchandise for the year 2018 and 2019:
TAN GENERAL MERCHANDISE
Comparative Statement of Financial Position
For the Year 2018 & 2019
2018
2019
ASSETS
Cash
Accounts Receivable
Inventory
Prepaid Rent
Total Current Assets
87,400.00
69,920.00
218,500.00
4,370.00
380, 190.00
110,000.00
90,000.00
129,000.00
12,000.00
341,000.00
Land
Building
Total Noncurrent Assets
493,810.00
500,000.00
993,810.00
550,000.00
600,000.00
1,150.000.00
TOTAL ASSETS
1,374,000.00
1,491,000.00
LIABILITIES
Accounts Payable
Notes payable
Total Current Liabilities
250,000.00
150,000,00
400.000.00
200,000.00
300.000.00
500,000.00
Mortgage Payable
Loan Payable
Total Noncurrent Liabilities
160,000.00
150,000.00
310,000.00
180,000.00
200,000.00
380,000.00
TOTAL LIABILITIES
710,000.00
880,000.00
OWNER'S EQUITY
664,000.00
1,374,000.00
611.000.00
Tan, Capital
Total Liabilities & Owner's Equity
1,491,000.00
22
TAN GENERAL MERCHANDISE
Comparative Statement of Comprehensive Income
For the Year 2018 & 2019
2018
Net Sales
Cost of Goods Sold
Gross Profit
Operating Expenses
Earnings Before Interest and Taxes 131,900.00
Interest Expense
Net Income Before Tax
2019
810,000.00
301.750.00
508,250.00
234,900,00
273,350.00
40.500.00
232,850.00
69,855.00
686,000.00
348,300.00
337,700.00
205,800.00
17.150.00
114,750.00
34,425.00
80,325.00
Income Tax
Net Income After Tax
162,995.00
Expert Solution
This question has been solved!
Explore an expertly crafted, step-by-step solution for a thorough understanding of key concepts.

This is a popular solution!

Trending now
This is a popular solution!

Step by step
Solved in 3 steps

Knowledge Booster


Learn more about
Need a deep-dive on the concept behind this application? Look no further. Learn more about this topic, accounting and related others by exploring similar questions and additional content below.Recommended textbooks for you
College Accounting, Chapters 1-27 (New in Account…
Accounting
ISBN:
9781305666160
Author:
James A. Heintz, Robert W. Parry
Publisher:
Cengage Learning

Cornerstones of Financial Accounting
Accounting
ISBN:
9781337690881
Author:
Jay Rich, Jeff Jones
Publisher:
Cengage Learning

Intermediate Accounting: Reporting And Analysis
Accounting
ISBN:
9781337788281
Author:
James M. Wahlen, Jefferson P. Jones, Donald Pagach
Publisher:
Cengage Learning
College Accounting, Chapters 1-27 (New in Account…
Accounting
ISBN:
9781305666160
Author:
James A. Heintz, Robert W. Parry
Publisher:
Cengage Learning
Cornerstones of Financial Accounting
Accounting
ISBN:
9781337690881
Author:
Jay Rich, Jeff Jones
Publisher:
Cengage Learning
Intermediate Accounting: Reporting And Analysis
Accounting
ISBN:
9781337788281
Author:
James M. Wahlen, Jefferson P. Jones, Donald Pagach
Publisher:
Cengage Learning

Survey of Accounting (Accounting I)
Accounting
ISBN:
9781305961883
Author:
Carl Warren
Publisher:
Cengage Learning