QUESTION 7 P18.3А P18.3A (LO 3) Jergan Corporation are presented here. Perform ratio analysis, and discuss changes in financial position and operating results. Jergan Corporation Condensed balance sheet and income statement data for Balance Sheets December 31 2020 2019 2018 Cash $ 30,000 $ 20,000 $ 18,000 Accounts receivable (net) 50,000 45,000 48,000 Other current assets 90,000 95,000 64,000 Investments 55,000 70,000 45,000 Plant and equipment (net) 500,000 370,000 358,000 $725,000 $600,000 $533,000 Current liabilities $ 85,000 $ 80,000 $ 70,000 Long-term debt Common stock, $10 par 145,000 85,000 50,000 320,000 310,000 300,000 Retained earnings 175,000 125,000 113,000 $725,000 $600,000 $533,000 Jergan Corporation Income Statements For the Years Ended December 31 2020 2019 Sales revenue $740,000 $600,000 Less: Sales returns and allowances 40,000 30,000 Net sales 700,000 570,000 Cost of goods sold Gross profit 425,000 350,000 275,000 220,000 Operating expenses (including income taxes) 180,000 150,000 Net income $ 95,000 $ 70,000 Additional information: 1. The market price of Jergan's common stock was $7.00, $7.50, and $8.50 for 2018, 2019, and 2020, respectively. 2. You must compute dividends paid. All dividends were paid in cash. Instructions a. Compute the following ratios for 2019 and 2020. •1. Profit margin. •2. Gross profit rate. •3. Asset turnover. •4. Earnings per share. •5. Price-earnings ratio. •6. Payout ratio. •7. Debt to assets ratio. b. Based on the ratios calculated, discuss briefly the improvement or lack thereof in the financial position and operating results from 2019 to 2020 of Jergan Corporation.
QUESTION 7 P18.3А P18.3A (LO 3) Jergan Corporation are presented here. Perform ratio analysis, and discuss changes in financial position and operating results. Jergan Corporation Condensed balance sheet and income statement data for Balance Sheets December 31 2020 2019 2018 Cash $ 30,000 $ 20,000 $ 18,000 Accounts receivable (net) 50,000 45,000 48,000 Other current assets 90,000 95,000 64,000 Investments 55,000 70,000 45,000 Plant and equipment (net) 500,000 370,000 358,000 $725,000 $600,000 $533,000 Current liabilities $ 85,000 $ 80,000 $ 70,000 Long-term debt Common stock, $10 par 145,000 85,000 50,000 320,000 310,000 300,000 Retained earnings 175,000 125,000 113,000 $725,000 $600,000 $533,000 Jergan Corporation Income Statements For the Years Ended December 31 2020 2019 Sales revenue $740,000 $600,000 Less: Sales returns and allowances 40,000 30,000 Net sales 700,000 570,000 Cost of goods sold Gross profit 425,000 350,000 275,000 220,000 Operating expenses (including income taxes) 180,000 150,000 Net income $ 95,000 $ 70,000 Additional information: 1. The market price of Jergan's common stock was $7.00, $7.50, and $8.50 for 2018, 2019, and 2020, respectively. 2. You must compute dividends paid. All dividends were paid in cash. Instructions a. Compute the following ratios for 2019 and 2020. •1. Profit margin. •2. Gross profit rate. •3. Asset turnover. •4. Earnings per share. •5. Price-earnings ratio. •6. Payout ratio. •7. Debt to assets ratio. b. Based on the ratios calculated, discuss briefly the improvement or lack thereof in the financial position and operating results from 2019 to 2020 of Jergan Corporation.

Survey of Accounting (Accounting I)
8th Edition
ISBN:9781305961883
Author:Carl Warren
Publisher:Carl Warren
Chapter9: Metric-analysis Of Financial Statements
Section: Chapter Questions
Problem 9.4.10P: Twenty metrics of liquidity, solvency, and profitability The comparative financial statements of...

Related questions
Question
Transcribed Image Text:QUESTION 7
Р18.3А
P18.ЗА (LO 3)
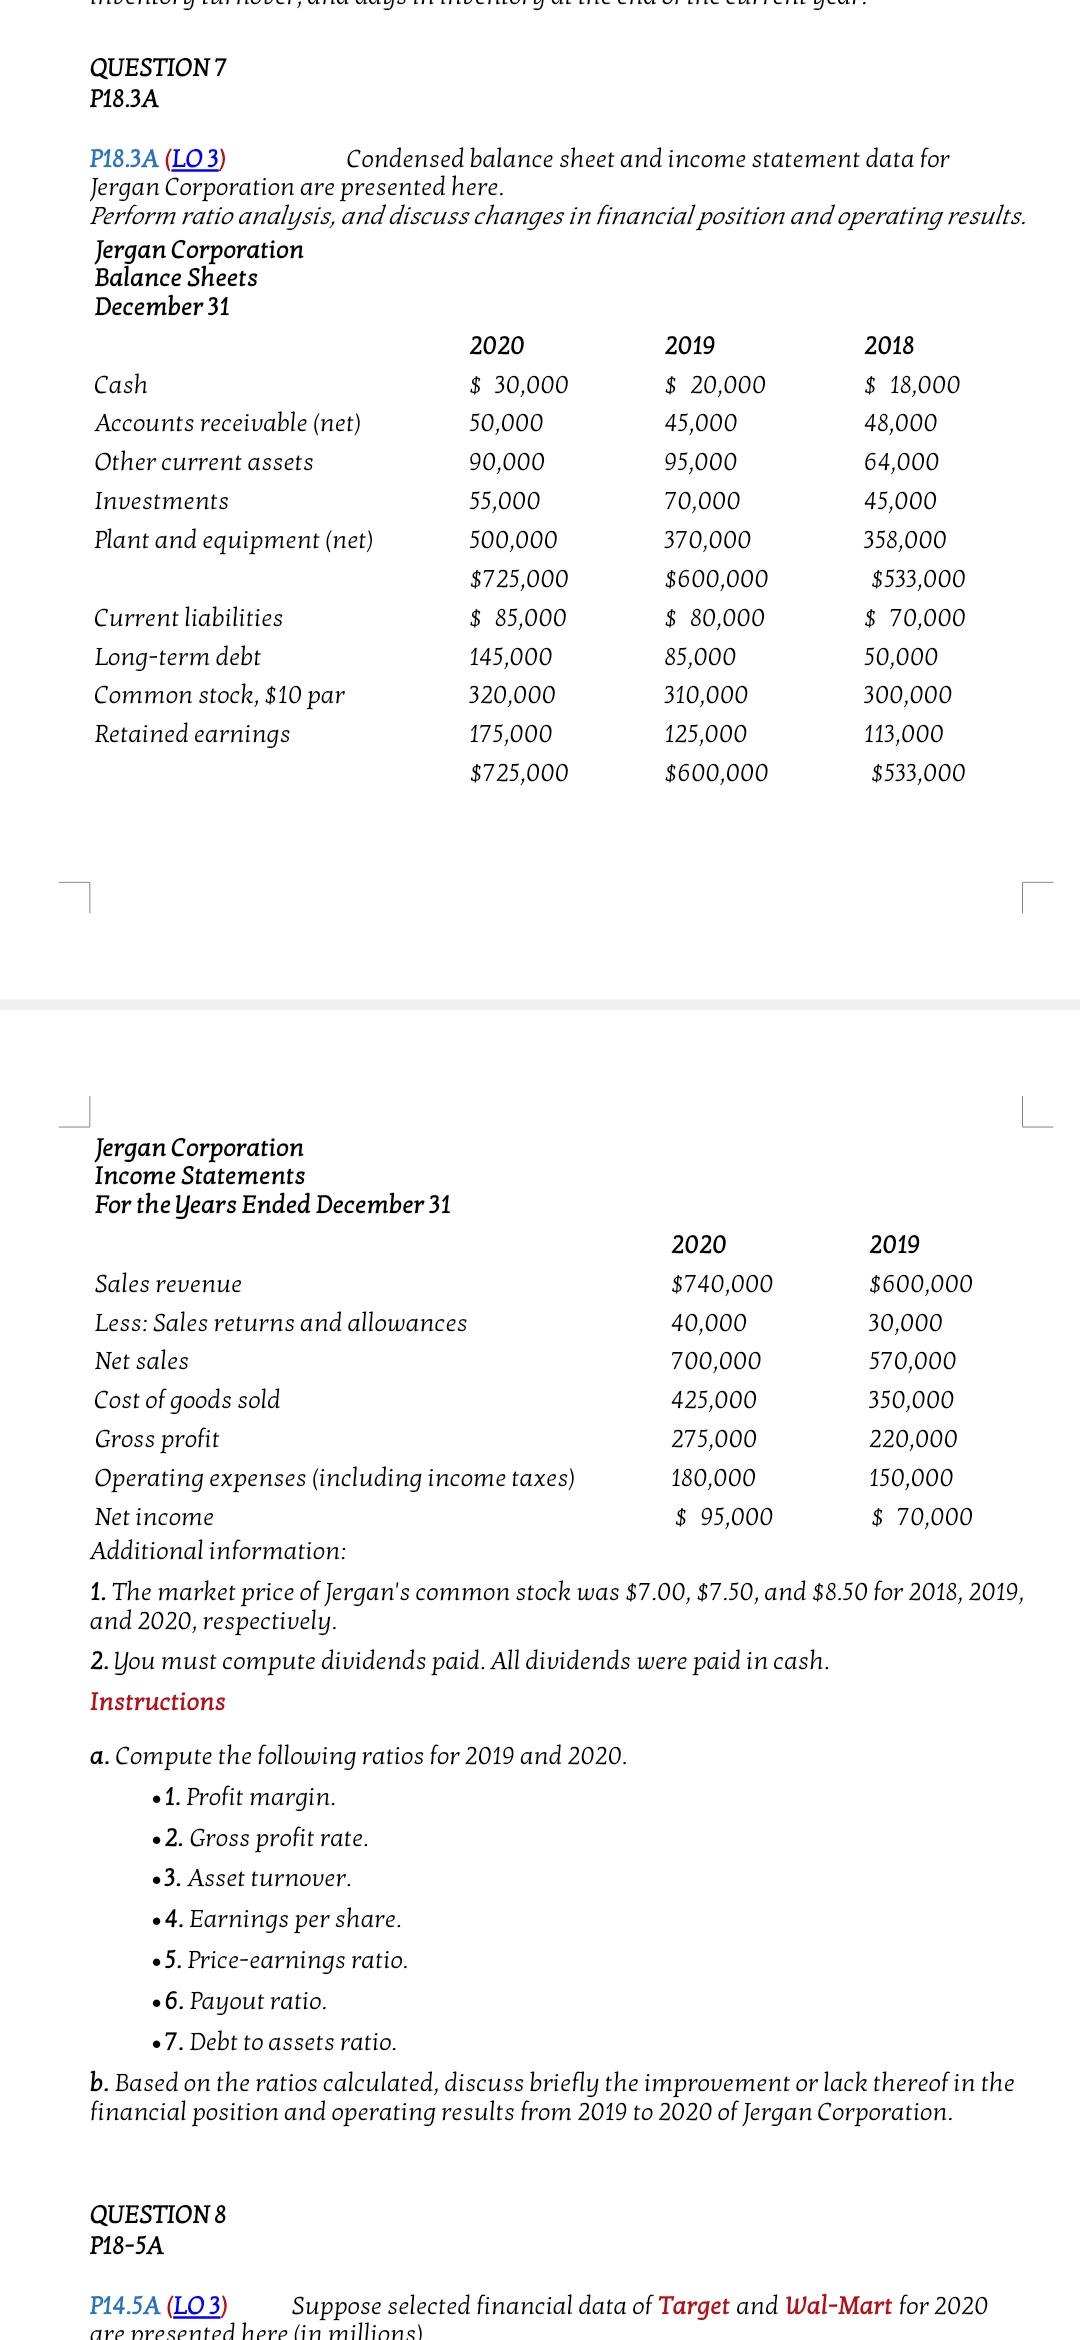
Jergan Corporation are presented here.
Perform ratio analysis, and discuss changes in financial position and operating results.
Jergan Corporation
Condensed balance sheet and income statement data for
Balance Sheets
December 31
2020
2019
2018
Cash
$ 30,000
$ 20,000
$ 18,000
Accounts receivable (net)
50,000
45,000
48,000
Other current assets
90,000
95,000
64,000
Investments
55,000
70,000
45,000
Plant and equipment (net)
500,000
370,000
358,000
$725,000
$600,000
$533,000
Current liabilities
$ 85,000
$ 80,000
$ 70,000
Long-term debt
Common stock, $10 par
145,000
85,000
50,000
320,000
310,000
300,000
Retained earnings
175,000
125,000
113,000
$725,000
$600,000
$533,000
Jergan Corporation
Income Statements
For the Years Ended December 31
2020
2019
Sales revenue
$740,000
$600,000
Less: Sales returns and allowances
40,000
30,000
Net sales
700,000
570,000
Cost of goods sold
Gross profit
425,000
350,000
275,000
220,000
Operating expenses (including income taxes)
180,000
150,000
Net income
$ 95,000
$ 70,000
Additional information:
1. The market price of Jergan's common stock was $7.00, $7.50, and $8.50 for 2018, 2019,
and 2020, respectively.
2. You must compute dividends paid. All dividends were paid in cash.
Instructions
a. Compute the following ratios for 2019 and 2020.
•1. Profit margin.
• 2. Gross profit rate.
•3. Asset turnover.
•4. Earnings per share.
•5. Price-earnings ratio.
•6. Payout ratio.
•7. Debt to assets ratio.
b. Based on the ratios calculated, discuss briefly the improvement or lack thereof in the
financial position and operating results from 2019 to 2020 of Jergan Corporation.
QUESTION 8
Р18-5A
P14.5A (LO 3)
are presented here (in millions)
Suppose selected financial data of Target and Wal-Mart for 2020
Transcribed Image Text:QUESTION 8
P18-5A
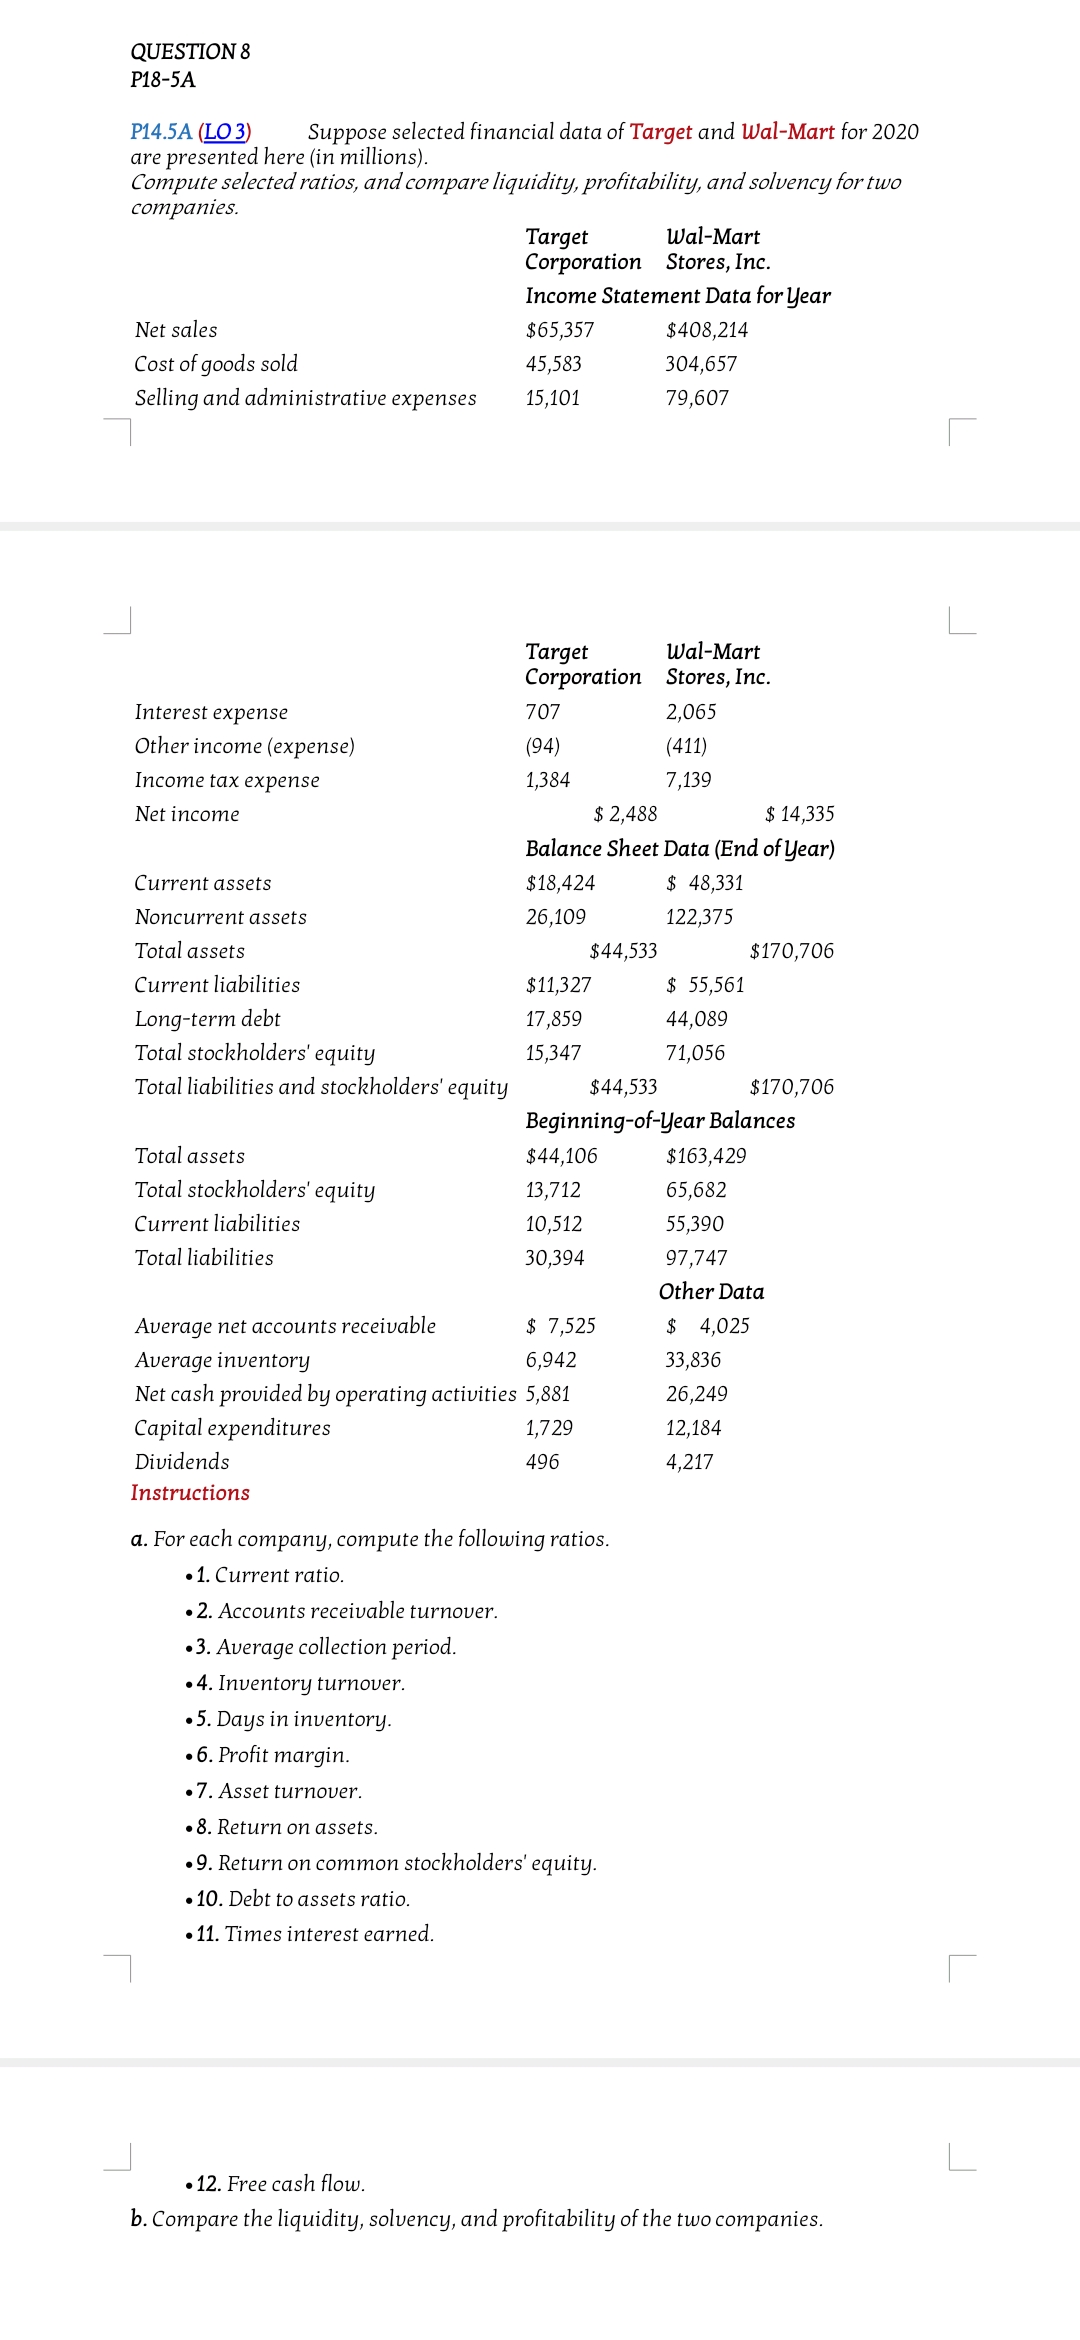
Р14.5A (LO 3)
are presented here (in millions).
Compute selected ratios, and compare liquidity, profitability, and solvency for two
соmpanies.
Suppose selected financial data of Target and Wal-Mart for 2020
Wal-Mart
Target
Corporation Stores, Inc.
Income Statement Data for Year
Net sales
$65,357
$408,214
Cost of goods sold
Selling and administrative expenses
45,583
304,657
15,101
79,607
Target
Corporation Stores, Inc.
Wal-Mart
Interest expense
707
2,065
Other income (expense)
(94)
(411)
Income tax eхрense
1,384
7,139
$ 2,488
Balance Sheet Data (End of Year)
Net income
$ 14,335
Current assets
$18,424
$ 48,331
Noncurrent assets
26,109
122,375
Total assets
$44,533
$170,706
Current liabilities
$11,327
$ 55,561
Long-term debt
Total stockholders' equity
17,859
44,089
15,347
71,056
Total liabilities and stockholders' equity
$44,533
$170,706
Beginning-of-Year Balances
Total assets
$44,106
$163,429
Total stockholders' equity
13,712
65,682
Current liabilities
10,512
55,390
Total liabilities
30,394
97,747
Other Data
Average net accounts receivable
Average inventory
Net cash provided by operating activities 5,881
$ 7,525
$ 4,025
6,942
33,836
26,249
Capital expenditures
1,729
12,184
Dividends
496
4,217
Instructions
a. For each company, compute the following ratios.
•1. Current ratio.
•2. Accounts receivable turnover.
•3. Average collection period.
•4. Inventory turnover.
•5. Days in inventory.
•6. Profit margin.
•7. Asset turnover.
•8. Return on assets.
•9. Return on common stockholders' equity.
• 10. Debt to assets ratio.
• 11. Times interest earned.
• 12. Free cash flow.
b. Compare the liquidity, solvency, and profitability of the two companies.
Expert Solution
This question has been solved!
Explore an expertly crafted, step-by-step solution for a thorough understanding of key concepts.

This is a popular solution!

Trending now
This is a popular solution!

Step by step
Solved in 3 steps

Knowledge Booster


Learn more about
Need a deep-dive on the concept behind this application? Look no further. Learn more about this topic, accounting and related others by exploring similar questions and additional content below.Recommended textbooks for you
Survey of Accounting (Accounting I)
Accounting
ISBN:
9781305961883
Author:
Carl Warren
Publisher:
Cengage Learning

Financial & Managerial Accounting
Accounting
ISBN:
9781285866307
Author:
Carl Warren, James M. Reeve, Jonathan Duchac
Publisher:
Cengage Learning

Survey of Accounting (Accounting I)
Accounting
ISBN:
9781305961883
Author:
Carl Warren
Publisher:
Cengage Learning
Financial & Managerial Accounting
Accounting
ISBN:
9781285866307
Author:
Carl Warren, James M. Reeve, Jonathan Duchac
Publisher:
Cengage Learning

College Accounting, Chapters 1-27 (New in Account…
Accounting
ISBN:
9781305666160
Author:
James A. Heintz, Robert W. Parry
Publisher:
Cengage Learning

Fundamentals of Financial Management (MindTap Cou…
Finance
ISBN:
9781337395250
Author:
Eugene F. Brigham, Joel F. Houston
Publisher:
Cengage Learning

Fundamentals Of Financial Management, Concise Edi…
Finance
ISBN:
9781337902571
Author:
Eugene F. Brigham, Joel F. Houston
Publisher:
Cengage Learning